ASX COMPANY FACT RECORD
Yancoal Australia — company, asset and project record
Coal operations, production, resources, reserves, approvals and closure activities.
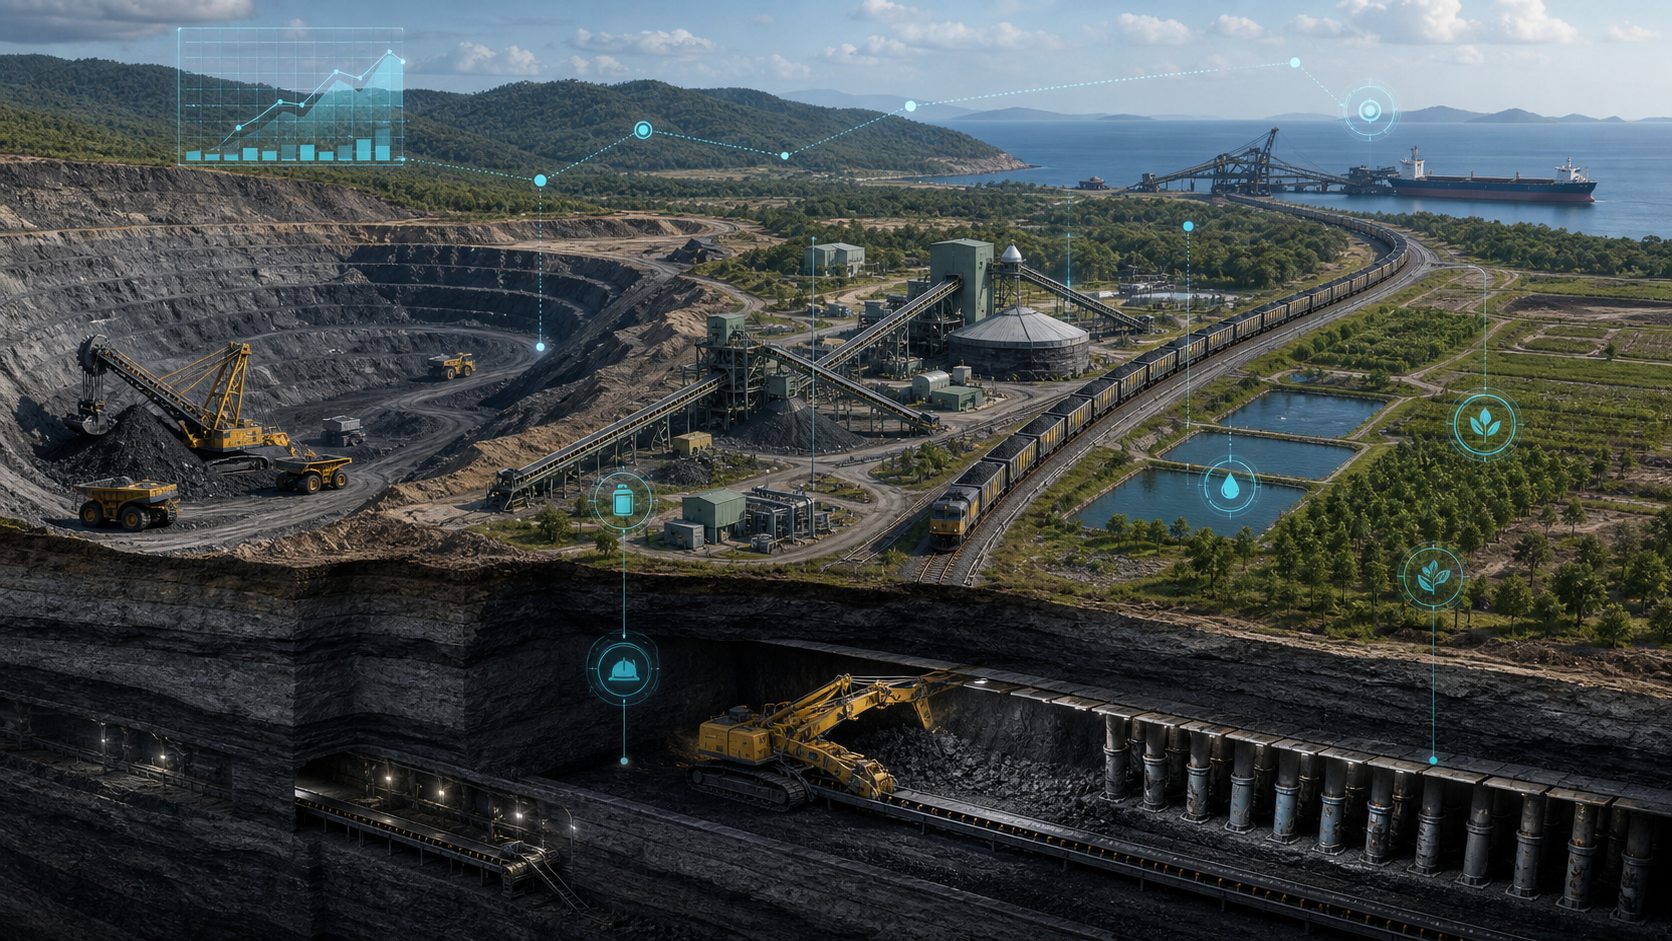
01
1. Reporting identity, scope and time convention
This record covers the five Yancoal Australia annual reports for the financial years ended 31 December 2021, 2022, 2023, 2024 and 2025. Yancoal is listed on the ASX as YAL and on the Hong Kong Stock Exchange as 3668. Each FY label below refers to the year ended on 31 December, rather than to the calendar year in which a report was published.
The reports use three production lenses which are deliberately kept separate in this record:
- 100% mine basis: total output of a mine before applying Yancoal's economic interest.
- Attributable saleable production: ownership-weighted output of Yancoal's consolidated operations, generally excluding Middlemount.
- Equity basis: attributable output plus Yancoal's equity-accounted share of Middlemount where the report presents it.
The three measures are not substitutes. In particular, Middlemount must not be added both to attributable output and again as an equity-accounted contribution. Asset status, ownership and accounting treatment are reported as disclosed in the relevant FY; this record does not assume they remained unchanged in other years.
Section sources. Yancoal Australia FY2021 Annual Report, “Management Discussion and Analysis”; Yancoal Australia FY2022 Annual Report, “Management Discussion and Analysis”; Yancoal Australia FY2023 Annual Report, “Management Discussion and Analysis”; Yancoal Australia FY2024 Annual Report, “Management Discussion and Analysis”; Yancoal Australia FY2025 Full Year Financial Report, “Management Discussion and Analysis”.
02
2. Portfolio map and reporting boundary
| Asset / complex | State | Reported mine type / products | Reported interest and treatment | FY2021–FY2025 status record |
|---|---|---|---|---|
| Moolarben | NSW | Open-cut and underground; thermal coal | 95% through FY2024; 98.75% after 3 October 2025; controlled unincorporated JV | Operating throughout |
| Mount Thorley Warkworth (MTW) | NSW | Open-cut; semi-soft coking and thermal coal | Mount Thorley and Warkworth interests are separately reported in technical tables; controlled operations | Operating throughout |
| Hunter Valley Operations (HVO) | NSW | Open-cut; semi-soft coking and thermal coal | 51% economic interest; Hunter Valley JV operation | Operating throughout; continuation approval process active in FY2025 |
| Yarrabee | QLD | Open-cut; PCI and thermal coal | 100%; Yancoal operated | Operating throughout |
| Middlemount | QLD | Open-cut; PCI and hard-coking / metallurgical coal | 49.9997% incorporated JV; equity accounted | Operating throughout |
| Ashton / Watagan / RUMEx | NSW | Underground; semi-soft coking and thermal coal | 100% reported in technical tables | Operating, with declining/variable output over the period |
| Stratford-Duralie / Gloucester | NSW | Open-cut thermal coal | 100% reported | Duralie mining ceased in FY2022; Stratford ceased mining in May 2024; closure activity thereafter |
| Austar | NSW | Former underground mine | 100% / Watagan group presentation | Care and maintenance / closure activity throughout the record |
| Donaldson | NSW | Former thermal-coal asset | Watagan group presentation | Care and maintenance to FY2024; sale completed December 2025 |
| Monash | NSW | Underground exploration interest | 100% in FY2021 resource statement | Impaired in FY2022; later tables do not separately present it |
| Cameby Downs and Premier Coal | QLD / WA | Managed mines | Operated for majority shareholder; not automatically a controlled-Yancoal output boundary | Managed assets; excluded from FY2025 sustainability-report boundary |
The annual reports describe an Australian portfolio of thermal, semi-soft coking, PCI and mid/high-ash thermal coal products. Cameby Downs and Premier are discussed because Yancoal manages them, but their production, reserves, emissions and revenue are not included in this record as Yancoal-owned or attributable unless a report expressly gives that basis.
Section sources. Yancoal Australia FY2021 Annual Report, “Business Overview”, “Management Discussion and Analysis” and “Coal Resources and Coal Reserves”; Yancoal Australia FY2022 Annual Report, “Management Discussion and Analysis” and “Coal Resources and Coal Reserves”; Yancoal Australia FY2023 Annual Report, “Management Discussion and Analysis” and “Coal Resources and Coal Reserves”; Yancoal Australia FY2024 Annual Report, “Management Discussion and Analysis” and “Coal Resources and Coal Reserves”; Yancoal Australia FY2025 Full Year Financial Report, “Management Discussion and Analysis” and “Coal Resources and Coal Reserves”.
03
3. Five-year company chronology and production-basis bridge
| FY | Operating conditions and actions recorded by the company | Reported group outcome / capital event |
|---|---|---|
| 2021 | COVID-related workforce absences, heavy rainfall, rail/port disruption and a Moolarben underground hard-rock intrusion were reported. The company used Key Tasks / Four Initiatives, water and product-quality actions. | 100%-basis ROM 63.2Mt; saleable output 48.5Mt; equity-basis saleable output 38.6Mt including 1.9Mt Middlemount. Early US$500m debt repayment and dividend resumption were reported. |
| 2022 | Flooding, labour constraints, inflation and equipment/contractor recovery were reported. Water-management investment continued. | 100%-basis ROM 50.5Mt. The company repaid US$2.6bn of external debt and declared its first fully franked final dividend of A$0.70/share. |
| 2023 | Recovery work included pre-strip, overburden removal, inventory rebuilding, dewatering and water-storage work. Fifty Key Tasks workstreams were reported. | 100%-basis ROM 60.2Mt; attributable sales 33.4Mt. The company reported US$333m early debt repayment and dividends of A$0.37 interim plus A$0.325 final per share. |
| 2024 | The reports described return to steady-state conditions after wet-weather recovery and 42 Key Tasks workstreams. Leadership changed; Austar closure operations included a September contractor fatality, with investigation stated ongoing. | 100%-basis ROM 62.7Mt and saleable output 47.8Mt; attributable saleable output 36.9Mt excluding Middlemount / 38.0Mt equity basis including it. |
| 2025 | The reports recorded 45 Key Tasks workstreams, May NSW wet weather and Port of Newcastle disruption, and completion of the additional Moolarben interest acquisition. | 100%-basis ROM 67.0Mt and saleable output 50.8Mt; attributable saleable output 38.6Mt excluding Middlemount / 39.9Mt equity basis including it. |
Group production and sales record
| Metric | FY2021 | FY2022 | FY2023 | FY2024 | FY2025 | Basis |
|---|---|---|---|---|---|---|
| ROM coal production (Mt) | 63.2 | 50.5 | 60.2 | 62.7 | 67.0 | 100% mine basis, including Middlemount where reported |
| Saleable coal production (Mt) | 48.5 | 38.9 | 43.6 | 47.8 | 50.8 | 100% mine basis |
| Attributable saleable output, excluding Middlemount (Mt) | 36.7 | 29.4 | 33.4 | 36.9 | 38.6 | Ownership-adjusted production; do not add to 100%-basis output |
| Ex-mine sales (Mt) | 37.5 | 29.3 | 33.1 | 37.7 | 38.1 | Sales measure; not interchangeable with attributable production |
| Equity-basis saleable output incl. Middlemount (Mt) | 38.6 | 30.7 | 34.5 | 38.0 | 39.9 | Do not add to attributable output again |
| Average ex-mine price (A$/t) | 141 | 378 | 232 | 176 | 146 | Reported group average |
| Cash operating cost (A$/t, excluding government royalties) | 67 | 94 | 96 | 93 | 92 | Reported measure |
n/r means this integrated section has not normalised a different source presentation into a comparable number. The company describes certain price, volume, cost and production drivers in its MD&A; those remain company explanations, not independent causal conclusions by MII.
Section sources. Yancoal Australia FY2021 Annual Report, “Management Discussion and Analysis”; Yancoal Australia FY2022 Annual Report, “Management Discussion and Analysis”; Yancoal Australia FY2023 Annual Report, “Management Discussion and Analysis”; Yancoal Australia FY2024 Annual Report, “Management Discussion and Analysis”; Yancoal Australia FY2025 Full Year Financial Report, “Management Discussion and Analysis”.
04
4. Moolarben: open-cut and underground record
Moolarben is reported as a NSW thermal-coal operation with separate open-cut and underground components. Yancoal's combined interest was 95% through FY2024. Legal completion of the additional 3.75% purchase occurred on 3 October 2025, taking the interest to 98.75%; financial consolidation of the increase began from that completion date and the report identifies 0.2Mt of FY2025 attributable contribution from it. The transaction separately had an effective economic-interest date of 1 January 2025, with a purchase-price adjustment for 1 January–3 October; those legal, accounting and economic dates are not interchangeable or back-applied to earlier years.
| Moolarben production (Mt) | FY2021 | FY2022 | FY2023 | FY2024 | FY2025 |
|---|---|---|---|---|---|
| ROM, 100% mine basis | 20.4 | 16.9 | 20.4 | 21.2 | 21.6 |
| Saleable, 100% mine basis | 18.4 | 14.9 | 16.7 | 19.0 | 19.1 |
| Attributable saleable, as reported | 17.4 | 14.1 | 15.9 | 18.0 | 18.3 |
| Coal Resources, 100% basis (Mt) | 1,070 | 1,030 | 990 | 945 | 855 |
| Marketable reserves, 100% basis (Mt) | 182 | 169 | 178 | 160 | 141 |
In FY2021, the company reported an unknown hard-rock intrusion in a known dyke that suspended underground longwall operations for eleven weeks while drilling and blasting enabled the longwall to pass it. It estimated 1.2Mt of equity-basis ROM was lost. The FY2021 report also reported weather impacts on open-cut activity. FY2025 attributed the ROM increase relative to FY2024 to improved underground conditions after poor strata encountered at times in FY2024; it described open-cut output as effectively at the 16Mtpa consent limit.
The FY2021 annual report recorded approval to increase open-cut annual ROM from 14Mtpa to 16Mtpa, conditional in implementation on greater coal-handling-and-preparation-plant capacity and a company investment decision. By FY2025, the report described the open cut as at its effective consent limit; this is not a statement that further expansion was approved. The records describe continuing study/assessment of underground work, without representing an unapproved development as built or operating.
Moolarben project/status record
| Matter | Reported status |
|---|---|
| Open-cut ROM limit | Approval to 16Mtpa recorded in FY2021; output described at effective consent limit in FY2025 |
| Additional ownership | Completed 3 October 2025; 95% to 98.75% |
| Underground conditions | FY2021 hard-rock intrusion; FY2025 improved conditions relative to FY2024 poor strata disclosure |
| Underground development | Subject to further assessment / study in the annual-report record; no public-report claim of a completed new underground development |
Section sources. Yancoal Australia FY2021 Annual Report, “Business Overview”, “Management Discussion and Analysis” and “Coal Resources and Coal Reserves”; Yancoal Australia FY2022 Annual Report, “Management Discussion and Analysis” and “Coal Resources and Coal Reserves”; Yancoal Australia FY2023 Annual Report, “Management Discussion and Analysis” and “Coal Resources and Coal Reserves”; Yancoal Australia FY2024 Annual Report, “Management Discussion and Analysis” and “Coal Resources and Coal Reserves”; Yancoal Australia FY2025 Full Year Financial Report, “Management Discussion and Analysis” and “Coal Resources and Coal Reserves”.
05
5. Mount Thorley Warkworth: separate mine components within one complex
MTW is a NSW open-cut complex producing semi-soft coking and thermal coal. The source technical statements distinguish Mount Thorley and Warkworth rather than treating them as a single resource estimate. Interest percentages vary by source table: the portfolio presentation may round to 83%, while technical tables separately show Mount Thorley at 80% and Warkworth at about 84.47%. This record retains the distinction.
| MTW production / estimates | FY2021 | FY2022 | FY2023 | FY2024 | FY2025 |
|---|---|---|---|---|---|
| ROM, 100% basis (Mt) | 16.5 | 12.4 | 17.2 | 17.2 | 17.7 |
| Saleable, 100% basis (Mt) | 11.2 | 8.1 | 11.3 | 11.2 | 11.8 |
| Attributable saleable, as reported (Mt) | 9.3 | 6.7 | 9.2 | 9.3 | 9.8 |
| Mt Thorley Coal Resources, 100% basis (Mt) | 428 | 425 | 425 | 425 | 425 |
| Warkworth Coal Resources, 100% basis (Mt) | 932 | 925 | 905 | 885 | 875 |
| MTW marketable reserves, 100% basis (Mt) | 178 | 169 | 169 | 157 | 145 |
FY2021 reported lower ROM and saleable production than FY2020, attributed to wet-weather mine scheduling and lower bypass coal. FY2025 reported output recovery from wet weather and schedule changes, with higher CHPP feed supported by managed feed stockpiles. These are the company's recorded explanations for those annual movements.
In FY2025, the company kept the underground concept at a preliminary study stage and said the next feasibility work was expected to begin in the first quarter of 2026. Any later development was described as a possible way to lengthen the production profile without raising annual output limits. No construction approval, investment decision or production forecast was reported.
Section sources. Yancoal Australia FY2021 Annual Report, “Business Overview”, “Management Discussion and Analysis” and “Coal Resources and Coal Reserves”; Yancoal Australia FY2022 Annual Report, “Management Discussion and Analysis” and “Coal Resources and Coal Reserves”; Yancoal Australia FY2023 Annual Report, “Management Discussion and Analysis” and “Coal Resources and Coal Reserves”; Yancoal Australia FY2024 Annual Report, “Management Discussion and Analysis” and “Coal Resources and Coal Reserves”; Yancoal Australia FY2025 Full Year Financial Report, “Management Discussion and Analysis” and “Coal Resources and Coal Reserves”.
06
6. Hunter Valley Operations: joint-operation record and continuation boundary
HVO is a NSW open-cut operation producing semi-soft coking and thermal coal. It is reported with a 51% economic interest and as a Hunter Valley Joint Venture operation. The relevant production tables present 100%-basis mine output; ownership weighting must be separately labelled.
| HVO production / estimates | FY2021 | FY2022 | FY2023 | FY2024 | FY2025 |
|---|---|---|---|---|---|
| ROM, 100% basis (Mt) | 14.4 | 11.9 | 15.3 | 14.8 | 18.8 |
| Saleable, 100% basis (Mt) | 10.6 | 9.6 | 10.5 | 11.7 | 14.1 |
| Attributable saleable, as reported (Mt) | 5.4 | 4.9 | 5.4 | 6.0 | 7.2 |
| Coal Resources, 100% basis (Mt) | 4,480 | 4,470 | 4,080 | 3,750 | 3,730 |
| Marketable reserves, 100% basis (Mt) | 620 | 610 | 582 | 570 | 555 |
FY2021 output was described as affected by a planned reduction responding to the 2020 market and by wet weather. FY2025 attributed the increase to fewer drill-and-blast/equipment constraints and full-year operation of the second Howick CHPP; lower bypass volumes moderated saleable-production growth.
HVO continuation project: approval status must remain specific
The FY2024 report described a proposed material extension and an 18-month continuity application under assessment. In August 2025, the HVO JV lodged a revised project report with NSW DPHI. The FY2025 report states that NSW and Australian federal approvals remained required and that long-term approval was not guaranteed. It records approval of an interim extension to 31 December 2026. The interim extension is not a long-term approval and the record does not claim consent through FY2045 or FY2050.
Section sources. Yancoal Australia FY2021 Annual Report, “Business Overview”, “Management Discussion and Analysis” and “Coal Resources and Coal Reserves”; Yancoal Australia FY2022 Annual Report, “Management Discussion and Analysis” and “Coal Resources and Coal Reserves”; Yancoal Australia FY2023 Annual Report, “Management Discussion and Analysis” and “Coal Resources and Coal Reserves”; Yancoal Australia FY2024 Annual Report, “Management Discussion and Analysis” and “Coal Resources and Coal Reserves”; Yancoal Australia FY2025 Full Year Financial Report, “Management Discussion and Analysis” and “Coal Resources and Coal Reserves”.
07
7. Queensland operations: Yarrabee and Middlemount
Yarrabee
Yarrabee is a wholly owned, Yancoal-operated truck-and-shovel open-cut operation reported as producing ultra-low-volatility PCI coal and thermal coal.
| Yarrabee, 100% basis (Mt) | FY2021 | FY2022 | FY2023 | FY2024 | FY2025 |
|---|---|---|---|---|---|
| ROM production | 3.0 | 2.6 | 2.4 | 2.9 | 3.6 |
| Saleable production | 2.6 | 2.1 | 1.9 | 2.2 | 2.7 |
| Attributable saleable production | 2.6 | 2.1 | 1.9 | 2.2 | 2.7 |
| Coal Resources | 133 | 133 | 128 | 123 | 275 |
| Recoverable reserves | 81 | 78 | 76 | 73 | 70 |
| Marketable reserves | 61 | 59 | 57 | 55 | 52 |
The reports show lower output in FY2022 and FY2023, then higher output in FY2024 and FY2025. The FY2025 resource statement shows 275Mt Coal Resources compared with 123Mt in FY2024 while reporting 70Mt recoverable and 52Mt marketable reserves. The tables establish those estimate changes but the cited technical tables do not provide a single cause; none is inferred here.
Middlemount
Middlemount is a Queensland truck-and-shovel open-cut mine. Gloucester (SPV) Pty Ltd holds a 49.9997% interest in the incorporated Middlemount Coal Pty Ltd joint venture; the investment is equity accounted. Its 100%-basis mine tonnes and Yancoal's equity-basis contribution are therefore not consolidated production measures.
| Middlemount production / estimates (Mt) | FY2021 | FY2022 | FY2023 | FY2024 | FY2025 |
|---|---|---|---|---|---|
| ROM, 100% mine basis | 4.8 | 3.6 | 3.3 | 4.0 | 4.2 |
| Saleable, 100% mine basis | 3.7 | 2.6 | 2.2 | 2.3 | 2.6 |
| Yancoal equity-basis saleable output | 1.9 | 1.3 | 1.1 | 1.1 | 1.3 |
| Coal Resources, 100% basis | 158 | 155 | 152 | 148 | 144 |
| Recoverable reserves, 100% basis | 93 | 88 | 85 | 81 | 77 |
| Marketable reserves, 100% basis | 69 | 67 | 65 | 62 | 60 |
The reports also identify a 4% royalty on 100% of Middlemount free-on-board trimmed sales. Royalty revenue was reported as A$28m in FY2021, A$53m in FY2022, A$27m in FY2023, A$26m in FY2024 and A$25m in FY2025. The FY2022 report says Middlemount repaid its A$212m shareholder loan in full. Those investment, royalty and equity-accounted-result disclosures must not be substituted for mine revenue.
Section sources. Yancoal Australia FY2021 Annual Report, “Business Overview”, “Management Discussion and Analysis” and “Coal Resources and Coal Reserves”; Yancoal Australia FY2022 Annual Report, “Management Discussion and Analysis” and “Coal Resources and Coal Reserves”; Yancoal Australia FY2023 Annual Report, “Management Discussion and Analysis” and “Coal Resources and Coal Reserves”; Yancoal Australia FY2024 Annual Report, “Management Discussion and Analysis” and “Coal Resources and Coal Reserves”; Yancoal Australia FY2025 Full Year Financial Report, “Management Discussion and Analysis” and “Coal Resources and Coal Reserves”.
08
8. Ashton, Austar, Stratford-Duralie, Donaldson, Monash and managed mines
Ashton and Watagan nomenclature
Ashton is an underground NSW mine presented as a semi-soft coking/thermal operation. The annual resource tables also use Watagan/RUMEx naming. The names must not be silently treated as identical operating outputs. Saleable production was 1.2Mt in FY2021, 0.9Mt in FY2022, approximately 0.4Mt in FY2023, 1.3Mt in FY2024 and 0.5Mt in FY2025 on the reported 100%-basis production tables. The FY2025 resource statement lists Ashton 160Mt and Ashton RUMEx 30Mt Coal Resources; FY2025 marketable reserve rows list 10Mt for RUMEx and nil for Ashton underground.
Austar: closure and investigation status
The FY2021 report says Bellbird South mining had been completed in February 2020 and Austar was on care and maintenance because there was no immediate economically viable mine plan. Board-approved closure activity was then expected to take five to ten years; that historic planning range is not used as a current forecast. FY2022 disclosed a memorandum of understanding with Green Gravity to study whether former ventilation shafts could support kinetic-energy storage. It was a study, not an approved or constructed energy project.
FY2023 reported sealed shafts and ceased ventilation as closure work. FY2024 reported a contractor fatality during closure operations in September and said the NSW Resources Regulator investigation was ongoing. FY2025 continued to state that the investigation was ongoing. The annual reports do not supply a cause, liability finding or conclusion, and none is stated here.
Stratford-Duralie and Gloucester: production run-off and closure
| Stratford-Duralie record | FY2021 | FY2022 | FY2023 | FY2024 | FY2025 |
|---|---|---|---|---|---|
| ROM / saleable output (Mt, 100% basis) | 1.5 / 0.8 | 1.0 / 0.7 | 0.6 / 0.6 | 0.1 / 0.1 | 0 / 0 |
| Status | Operating | Duralie mining ceased; Stratford operating | Stratford expected to end in 2024 | Mining ceased May 2024; closure | Closure; Stratford plan completed, Duralie plan expected Q1 2026 |
FY2022 disclosed a A$30m Duralie rehabilitation-provision increase based on preliminary closure work. This is a provision movement, not a total closure cost. The reports describe a possible Stratford Renewable Energy Hub involving pumped hydro and solar: feasibility began in FY2022; later reports state that feasibility, permits, internal/external approvals and other conditions remained necessary. FY2024 records Critical State Significant Infrastructure status and a development application/EIS lodged in Q3 2024. FY2025 continues to describe approval risk and possible sunk costs if it does not proceed. The record does not call it built, approved for construction or operating.
The technical table trail shows Gloucester 100%-basis Coal Resources of 313Mt in FY2021/FY2022, 229Mt in FY2023, and 0 in FY2024; it was not separately tabulated in the FY2025 table inspected. A missing row is not restated as a legal, title, exhaustion or rehabilitation conclusion.
Donaldson and Monash
Donaldson remained on care and maintenance from FY2021 through FY2024. The reports record a A$100m exploration-asset impairment in FY2021 and A$171m operating-asset impairment in FY2022; those are accounting judgements, not an assertion that tenure or obligations ended. FY2025 records completion of a December sale and a A$22m non-cash gain arising from derecognition of rehabilitation provision and lease liabilities, partly offset by disposal of specified property and ancillary Ashton properties.
FY2021's technical statement listed Monash (UG) with 97Mt Coal Resources on a 100% basis. FY2022 recorded a A$144m exploration-asset impairment to nil and said future development was considered unlikely. Later resource tables did not separately present Monash; non-presentation is not converted into a zero-resource or title-status conclusion.
Cameby Downs and Premier Coal: managed-asset boundary
Yancoal describes operating Cameby Downs and Premier Coal for its majority shareholder. FY2025 states that they are outside its sustainability-report boundary because the owning entities are not controlled by Yancoal. This integration therefore does not add their output, resources, reserves, revenue or emissions to Yancoal's attributable portfolio. The FY2025 report did disclose a Premier framework guarantee with A$35m annual cap and approximately A$29.7m maximum daily outstanding principal plus fees; this is a support-arrangement disclosure, not ownership transfer.
Section sources. Yancoal Australia FY2021 Annual Report, “Business Overview”, “Management Discussion and Analysis” and “Coal Resources and Coal Reserves”; Yancoal Australia FY2022 Annual Report, “Management Discussion and Analysis” and “Coal Resources and Coal Reserves”; Yancoal Australia FY2023 Annual Report, “Management Discussion and Analysis” and “Coal Resources and Coal Reserves”; Yancoal Australia FY2024 Annual Report, “Management Discussion and Analysis” and “Coal Resources and Coal Reserves”; Yancoal Australia FY2025 Full Year Financial Report, “Management Discussion and Analysis” and “Coal Resources and Coal Reserves”.
09
9. Markets, products, customers and logistics
| FY | Recorded market / customer fact | Average price | Logistics / market context recorded |
|---|---|---|---|
| 2021 | Coal sold to 19 countries; Japan, Taiwan, South Korea and Singapore represented about 73% of coal-sales revenue. Metallurgical coal was 15% of attributable sales. | A$141/t | La Niña rain disrupted sites, rail and ports; diesel plus demurrage added more than A$2.20/t according to the company. |
| 2022 | Coal sold to 13 market destinations; European sales increased in the reported global-energy-market context. | A$378/t | Floods, labour shortages, diesel, explosives and demurrage were reported cost/operations factors. |
| 2023 | Coal sold to 14 markets; report records increased sales to China. | A$232/t | Recovery plans included dewatering, water-storage, pre-strip and inventory rebuilding. |
| 2024 | China, Japan and South Korea were 86% of coal-sales revenue. | A$176/t | Production was weighted to H2 due to mine planning and maintenance cycles. |
| 2025 | China, Japan, Taiwan and South Korea were about 81% of coal-sales revenue. | A$146/t | May NSW weather disrupted Port of Newcastle; vessel queue took most of H2 to clear and demurrage rose A$57m period on period. |
The reports say products are exported through Newcastle, Gladstone and Dalrymple Bay to Asia-Pacific customers. They do not support an asset-by-asset mine-to-terminal allocation in this record. FY2025 describes low-ash thermal product as generally GCNewc-indexed, higher-ash thermal product generally API5-indexed, certain thermal contracts referenced to Japanese Power Utility Reference Price, and metallurgical term/spot mechanisms linked to stated quarterly or Platts benchmarks. These are reported pricing mechanics, not price forecasts.
Section sources. Yancoal Australia FY2021 Annual Report, “Management Discussion and Analysis”; Yancoal Australia FY2022 Annual Report, “Management Discussion and Analysis”; Yancoal Australia FY2023 Annual Report, “Management Discussion and Analysis”; Yancoal Australia FY2024 Annual Report, “Management Discussion and Analysis”; Yancoal Australia FY2025 Full Year Financial Report, “Management Discussion and Analysis”.
10
10. Growth, approvals, closure and post-mining-use register
| Initiative | FY2021–FY2025 evidence-led status |
|---|---|
| Moolarben open-cut / CHPP | FY2021 approval to 16Mtpa ROM recorded, with implementation linked to CHPP capacity/investment; FY2025 output described at effective consent limit. No additional expansion approval is claimed. |
| Moolarben additional interest | Legal completion and consolidation from 3 October 2025: 95% to 98.75%; effective economic interest from 1 January 2025 with a purchase-price adjustment to completion. |
| MTW underground | Preliminary study work remained incomplete in FY2025; the company expected the next feasibility phase to start in Q1 2026. No construction approval was reported. |
| HVO continuation | Revised material lodged August 2025; interim extension approved to 31 December 2026; NSW/federal long-term approvals still required and not guaranteed. |
| Stratford Renewable Energy Hub | Feasibility/study from FY2022; Critical State Significant Infrastructure status and DA/EIS lodgement reported FY2024; continued internal/external approval conditions FY2025. Not an operating project. |
| Austar kinetic storage concept | FY2022 MoU/study with Green Gravity; no annual-report basis to claim approval, build or operation. |
| Stratford-Duralie closure | Mining ceased May 2024; FY2025 Stratford Detailed Mine Closure Plan completed and Duralie plan expected Q1 2026. |
| Donaldson | Sale completed December 2025; not a restart statement. |
| Diversification | Annual reports discuss renewable energy/other commodities as strategic assessment; no completed non-coal operating acquisition is established by the cited five reports. |
The company-wide improvement programme was called Four Initiatives / Key Tasks. FY2021 reported 48 workstreams and an estimated more-than-A$80m pre-tax profit benefit from certain initiatives. FY2023 reported 50 workstreams, FY2024 42 and FY2025 45. FY2025 remuneration disclosure records 36 of 45 tasks under successful management/control, A$32m annualised procurement savings against a A$25m target, and A$55m infrastructure-cost reductions. These statements retain their management/remuneration-disclosure character; they are not independent project-completion certificates.
Section sources. Yancoal Australia FY2021 Annual Report, “Management Discussion and Analysis”; Yancoal Australia FY2022 Annual Report, “Management Discussion and Analysis”; Yancoal Australia FY2023 Annual Report, “Management Discussion and Analysis”; Yancoal Australia FY2024 Annual Report, “Management Discussion and Analysis”; Yancoal Australia FY2025 Full Year Financial Report, “Management Discussion and Analysis”.
11
11. Financial results, cash, debt, capex, tax and distributions
| A$m unless stated | FY2021 | FY2022 | FY2023 | FY2024 | FY2025 |
|---|---|---|---|---|---|
| IFRS / reported revenue | 5,404 | 10,548 | 7,778 | 6,860 | 5,949 |
| Operating EBITDA (company additional measure) | 2,531 | 6,959 | 3,489 | 2,579 | 1,437 |
| Profit after tax / attributable profit as reported | 791 | 3,586 | 1,819 | 1,216 | 440 |
| Operating cash flow | 1,900 | n/r | n/r | n/r | 1,257 |
| Cash and cash equivalents | 1,495 | n/r | 1,400 | 2,461 | 2,127 |
| Capital expenditure / investing cash fact | 269 capex | n/r | n/r | 705 capex | 751 capex cash flow |
Operating EBITDA is labelled by Yancoal as an unaudited non-IFRS additional financial measure and should not be treated as a substitute for audited statutory profit. In FY2025, the company reported A$5.910bn operating revenue, A$1.437bn operating EBITDA and A$440m statutory profit after tax; it separately reported ex-mine sales of 38.1Mt, A$5.576bn ex-mine revenue and A$146/t average price.
Capital and distribution facts reported over the period include an early US$500m debt repayment in FY2021; US$2.6bn external-debt repayment in FY2022; US$333m early repayment in FY2023; and, at 31 December 2025, A$2.127bn cash, A$84m interest-bearing liabilities and A$2.043bn net cash. In November 2025, Yancoal refinanced contingent-liability facilities into an A$1.35bn five-year facility and reported A$285m undrawn bank guarantees at the year end.
The FY2025 report records a fully franked interim dividend of A$0.062/share, declared 19 August 2025, and A$769m cash dividends paid during FY2025 (the FY2024 final and FY2025 interim). A final fully franked A$0.122/share dividend was declared on 25 February 2026 for payment 15 April 2026; it is a post-31-December-2025 event, not a FY2025 cash payment.
Section sources. Yancoal Australia FY2021 Annual Report, “Management Discussion and Analysis” and “Financial Statements”; Yancoal Australia FY2022 Annual Report, “Management Discussion and Analysis” and “Financial Statements”; Yancoal Australia FY2023 Annual Report, “Management Discussion and Analysis” and “Financial Statements”; Yancoal Australia FY2024 Annual Report, “Management Discussion and Analysis” and “Financial Statements”; Yancoal Australia FY2025 Full Year Financial Report, “Management Discussion and Analysis”, “Financial Statements” and “Dividends and Dividend Policy”.
12
Section sources (issuer documents only)
- Yancoal FY2021 Annual Report — portfolio, MD&A, operations, projects and Coal Resources/Coal Reserves statement.
- Yancoal FY2022 Annual Report — operations, markets, financial performance and Coal Resources/Coal Reserves statement.
- Yancoal FY2023 Annual Report — Chairman/CEO review, MD&A, operations, project record and Coal Resources/Coal Reserves statement.
- Yancoal FY2024 Annual Report — Chairman/Acting CEO review, MD&A, risk/closure record and Coal Resources/Coal Reserves statement.
- Yancoal FY2025 Full-Year Financial Report — MD&A, financial/cash/debt record, project/approval status and Coal Resources/Coal Reserves statement.
Editorial boundary. This is a factual, paraphrased record of annual-report disclosures. Coal Resources include Coal Reserves and must not be added to them. Resource/reserve estimates are not production guarantees, mine-life forecasts or valuations. Proposed, study-stage, lodged and interim-approved matters retain those exact status distinctions. No valuation, target price, recommendation or forecast is made.
13
12. Coal Resources, recoverable reserves and marketable reserves
This section records technical estimates reported by Yancoal at each year-end. It does not convert tonnes into an economic value, mine-life statement, forecast, or valuation. The annual reports state that Coal Resources are inclusive of material converted to Coal Reserves; they are therefore not additional to reserves. Unless a table says otherwise, asset totals are on a 100%-basis and the Group totals below are Yancoal attributable share. Rounding follows the reporting standard used in the source, so subtotals may not sum exactly.
12.1 Five-year Group estimate record — attributable share, Mt
| Estimate category | FY2021 | FY2022 | FY2023 | FY2024 | FY2025 |
|---|---|---|---|---|---|
| Coal Resources (Measured + Indicated + Inferred) | 6,013 | 5,201 | 4,857 | 4,400 | 4,400 |
| Recoverable Coal Reserves (Proved + Probable) | 1,137 | 989 | 970 | 920 | 850 |
| Marketable Coal Reserves (Proved + Probable) | 819 | 731 | 720 | 680 | 640 |
The FY2025 report identifies 4,400Mt of attributable Coal Resources, 850Mt of attributable recoverable reserves and 640Mt of attributable marketable reserves at 31 December 2025, compared with 4,400Mt, 920Mt and 680Mt respectively a year earlier. The series is a succession of annual technical estimates; the reports should be consulted for the individual year’s assumptions, ownership percentages and rounding. The record does not establish a cause for any change unless the relevant source expressly does so.
12.2 Coal Resources by reporting asset — 100%-basis total, Mt
| Asset / reporting grouping | FY2021 | FY2022 | FY2023 | FY2024 | FY2025 | FY2025 ownership / coal type reported |
|---|---|---|---|---|---|---|
| Moolarben (open cut and underground) | 1,070 | 1,030 | 990 | 945 | 855 | 98.75%; thermal |
| Mount Thorley (open cut) | 428 | 425 | 425 | 425 | 425 | 80%; semi/thermal |
| Warkworth (open cut) | 932 | 925 | 905 | 885 | 875 | 84.47%; semi/thermal |
| HVO (open cut) | 4,480 | 4,470 | 4,080 | 3,750 | 3,730 | 51%; semi/thermal |
| Yarrabee (open cut) | 133 | 133 | 128 | 123 | 275 | 100%; PCI/thermal |
| Middlemount (open cut) | 158 | 155 | 152 | 148 | 144 | 50%; metallurgical/thermal |
| Ashton (underground) | 270 | 268 | 268 | 265 | 160 | 100%; semi/thermal |
| Ashton RUMEx (underground) | — | 30 | 30 | 30 | 30 | 100%; semi/thermal |
| Gloucester / legacy grouping | 313 | 313 | 229 | 0 | — | Closure/legacy presentation changes across reports |
| Donaldson | 690 | 0 | — | — | — | Care-and-maintenance / later presentation change |
“—” means that the item is not presented as a comparable row in that annual table; it is not a zero estimate. The 2025 resource table provides the latest category detail: Moolarben 550Mt Measured, 155Mt Indicated and 150Mt Inferred; MTW consists of Mount Thorley (237/113/75) and Warkworth (603/107/165); HVO 630/1,400/1,700; Yarrabee 55/140/80; Middlemount 68/55/21; Ashton 70/50/40; and Ashton RUMEx 5/25/0 Mt (Measured/Indicated/Inferred). The table’s 100%-basis total is 6,494Mt, while the attributable total is 4,400Mt.
12.3 FY2025 recoverable reserves — 100%-basis, Mt
| Asset / reserve grouping | Proved | Probable | Total recoverable reserve |
|---|---|---|---|
| Moolarben open cut | 140 | 3 | 143 |
| Moolarben underground | 11 | 13 | 23 |
| Mount Thorley open cut | 3.9 | 15 | 19 |
| Warkworth open cut | 136 | 56 | 193 |
| HVO open cut | 209 | 544 | 752 |
| Yarrabee open cut | 28 | 41 | 70 |
| Middlemount open cut | 58 | 19 | 77 |
| Ashton RUMEx underground | 6 | 14 | 20 |
| Ashton underground | 0 | 0 | 0 |
| Total 100%-basis (rounded) | 590 | 700 | 1,290 |
| Yancoal attributable share (rounded) | — | — | 850 |
12.4 FY2025 marketable reserves — 100%-basis, Mt
| Asset / reserve grouping | Proved | Probable | Total marketable reserve |
|---|---|---|---|
| Moolarben open cut | 114 | 2 | 117 |
| Moolarben underground | 11 | 13 | 24 |
| Mount Thorley open cut | 2.6 | 10 | 13 |
| Warkworth open cut | 95 | 37 | 132 |
| HVO open cut | 155 | 400 | 555 |
| Yarrabee open cut | 21 | 31 | 52 |
| Middlemount open cut | 42 | 17 | 60 |
| Ashton RUMEx underground | 3 | 7 | 10 |
| Ashton underground | 0 | 0 | 0 |
| Total 100%-basis (rounded) | 440 | 520 | 960 |
| Yancoal attributable share (rounded) | — | — | 640 |
The FY2025 parsed table carries comparison-year labels in certain reserve header cells that conflict with the surrounding FY2025 report context. The current-year asset totals and Group totals above are retained as reported, but the final numeric QA must reconcile the published PDF header before a future year-on-year proved/probable comparison is made from that table.
12.5 Asset-level marketable-reserve record where the annual tables present comparable totals, Mt (100%-basis)
| Asset grouping | FY2021 | FY2022 | FY2023 | FY2024 | FY2025 |
|---|---|---|---|---|---|
| Moolarben (OC + UG) | 182 | 169 | 178 | 160 | 141 |
| MTW (Mount Thorley + Warkworth) | 178 | 169 | 169 | 157 | 145 |
| HVO | 620 | 610 | 582 | 570 | 555 |
| Yarrabee | 61 | 59 | 57 | 55 | 52 |
| Middlemount | 69 | 67 | 65 | 62 | 60 |
| Ashton / RUMEx | 22 | 24 | see annual table | 23 | 10 |
| Stratford Duralie / Gloucester | 1.4 | 0.8 | 0.2 | 0 | — |
The Ashton FY2023 row must remain subject to table-level numeric QA before inclusion in a final year-on-year chart because the annual-report grouping changes between Ashton and RUMEx. The numbers are not filled by interpolation.
Section sources. Yancoal Australia FY2021 Annual Report, “Coal Resources and Coal Reserves”; Yancoal Australia FY2022 Annual Report, “Coal Resources and Coal Reserves”; Yancoal Australia FY2023 Annual Report, “Coal Resources and Coal Reserves”; Yancoal Australia FY2024 Annual Report, “Coal Resources and Coal Reserves”; Yancoal Australia FY2025 Full Year Financial Report, “Coal Resources and Coal Reserves”.
14
13. Exploration, drilling and reported tenure
The annual reports’ exploration tables cover capitalised exploration and evaluation activity and explicitly exclude pre-production drilling. They are not a complete account of all geology, land access or development activity.
| Reporting year | Capitalised exploration and evaluation payments (A$m) | Reported qualification |
|---|---|---|
| FY2021 | 6.1 | No mining-structure/infrastructure development activity reported; drill totals exclude pre-production drilling. |
| FY2022 | 1.8 | Same stated drilling exclusion and no mining-structure/infrastructure development activity. |
| FY2023 | 3.33 | Same stated drilling exclusion and no mining-structure/infrastructure development activity. |
| FY2024 | 13.2 | Same stated drilling exclusion and no mining-structure/infrastructure development activity. |
| FY2025 | 3.7 | Same stated drilling exclusion and no mining-structure/infrastructure development activity. |
FY2021 drilling reported 91 non-core Moolarben holes (5,269m), 16 core Moolarben holes (537m), five MTW core holes (1,594m), and 13 HVO non-core holes (1,354m) plus six HVO core holes (1,602m). FY2024 reported 67 Moolarben holes/3,711m, eight Stratford Duralie holes/1,139m, 24 Yarrabee holes/1,891m and 102 HVO holes/15,181m. FY2025 reported Moolarben 18 non-core holes/2,196m and four core holes/393m, and HVO 41 non-core holes/6,187m and ten core holes/1,601m. These are reported drilling counts and metres, not a statement of discovery, resource conversion or future production.
At 31 December 2025, the annual-report tenure register includes reported title categories across Moolarben, MTW, HVO, Yarrabee/Wilpeena, Middlemount, Ashton and Ashton RUMEx. The list comprises exploration licences, mining leases, coal leases, consolidated coal leases, assessment leases, authorisations and a mineral-development licence. It should be read as the report’s resource/reserve tenure register, not as an assurance of title, an exhaustive landholding schedule or an approval status for every future activity.
Section sources. Yancoal Australia FY2021 Annual Report, “Yancoal 2021 Exploration Drilling” and “Yancoal Australia Tenements”; Yancoal Australia FY2022 Annual Report, “Yancoal 2022 Exploration Drilling” and tenure table; Yancoal Australia FY2023 Annual Report, “Yancoal 2023 Exploration Drilling” and tenure table; Yancoal Australia FY2024 Annual Report, “Yancoal 2024 Exploration Drilling”; Yancoal Australia FY2025 Full Year Financial Report, “Yancoal 2025 Exploration Drilling” and “Yancoal Australia Tenements”.
15
14. Five-year financial record and reporting measures
The following is a historical record. “Operating EBITDA” is a management-defined, unaudited non-IFRS additional financial measure in the source and is shown separately from statutory revenue and profit after tax.
| A$m unless noted | FY2021 | FY2022 | FY2023 | FY2024 | FY2025 |
|---|---|---|---|---|---|
| IFRS / reported revenue | 5,404 | 10,548 | 7,778 | 6,860 | 5,949 |
| Operating EBITDA (non-IFRS) | 2,531 | 6,959 | 3,489 | 2,579 | 1,437 |
| Reported profit after tax | 791 | 3,586 | 1,819 | 1,216 | 440 |
| Ex-mine sales (Mt) | 37.5 | 29.3 | 33.1 | 37.7 | 38.1 |
| Average ex-mine selling price (A$/t) | 141 | 378 | 232 | 176 | 146 |
| Cash operating cost excluding government royalties (A$/t) | 67 | 94 | 96 | 93 | 92 |
The annual reports describe different operating conditions behind each year’s reported figures. FY2021 describes hard-rock intrusion, rainfall, logistics disruption and COVID-related workforce effects. FY2022 describes ongoing wet-weather, workforce and operating disruption. FY2023 records recovery plans in a drier period. FY2024 records recovery-plan completion and a return to stated steady-state conditions for sites, while FY2025 records 38.1Mt of ex-mine sales, lower average ex-mine price and A$57m more demurrage following NSW wet weather and Port of Newcastle disruption. This is source-reported context, not an MII prediction about future prices, costs or profitability.
Section sources. Yancoal Australia FY2021 Annual Report, “Management Discussion and Analysis” and “Financial Statements”; Yancoal Australia FY2022 Annual Report, “Management Discussion and Analysis” and “Financial Statements”; Yancoal Australia FY2023 Annual Report, “Management Discussion and Analysis” and “Financial Statements”; Yancoal Australia FY2024 Annual Report, “Management Discussion and Analysis” and “Financial Statements”; Yancoal Australia FY2025 Full Year Financial Report, “Management Discussion and Analysis” and “Financial Statements”.
16
15. Cash, financing, tax, dividends and capital expenditure
| A$m unless noted | FY2021 | FY2022 | FY2023 | FY2024 | FY2025 |
|---|---|---|---|---|---|
| Net operating cash flow | 1,900 | see statutory cash-flow statement | see statutory cash-flow statement | 2,133 | 1,257 |
| Investing cash flow | (306) | see statutory cash-flow statement | see statutory cash-flow statement | (687) | (744) |
| Financing cash flow | see statutory cash-flow statement | see statutory cash-flow statement | see statutory cash-flow statement | (498) | (816) |
| Cash and cash equivalents at year-end | 1,495 | see balance sheet | 1,400 | 2,461 | 2,127 |
| Interest-bearing liabilities at year-end | see balance sheet | see balance sheet | see balance sheet | 112 | 84 |
| Net cash at year-end | see balance sheet | see balance sheet | see balance sheet | 2,349 | 2,043 |
| Cash capital expenditure | 269 | see cash-flow statement | see cash-flow statement | 705 | 751 |
FY2021 included an early US$500m debt repayment. FY2022 disclosed US$2.6bn of debt repayment. FY2023 included a US$333m early repayment. In FY2025 the Group reported a A$1.35bn five-year contingent-liability facility completed on 28 November 2025; the report listed A$285m of undrawn bank guarantees at 31 December 2025, maturing in November 2030. The reported FY2025 cash balance was A$2.127bn, interest-bearing liabilities A$84m and net cash A$2.043bn.
Dividend declarations and payments need to be distinguished. FY2022 reported the first fully franked final dividend of A$0.70 per share. FY2023 reported A$0.370 interim and A$0.325 final dividends per share. FY2024’s A$0.520 fully franked final dividend was declared after the balance date on 20 February 2025 and paid on 30 April 2025. For FY2025, an A$0.062 interim dividend was declared in August 2025; a A$0.122 final dividend was declared after year-end on 25 February 2026 and was scheduled for payment on 15 April 2026. The source describes a policy subject to law, cash needs, directors’ duties and capital-management considerations; this record does not imply a future dividend.
Tax timing can materially affect annual cash flows. The FY2024 report, for example, attributes part of the change in operating cash flow to FY2023 tax payments including A$1.412bn paid in June 2023 for FY2022 taxable profits. It is reported as a cash-flow timing fact, not a measure of recurring earnings.
Section sources. Yancoal Australia FY2021 Annual Report, “Management Discussion and Analysis” and consolidated cash-flow statement; Yancoal Australia FY2022 Annual Report, “Dividends and Dividend Policy”, “Management Discussion and Analysis” and cash-flow statement; Yancoal Australia FY2023 Annual Report, “Dividends and Dividend Policy”, MD&A and cash-flow statement; Yancoal Australia FY2024 Annual Report, MD&A; Yancoal Australia FY2025 Full Year Financial Report, “Dividends and Dividend Policy” and MD&A.
17
16. Safety, environment, climate, rehabilitation and communities
| Reported metric / disclosure | FY2021 | FY2022 | FY2023 | FY2024 | FY2025 |
|---|---|---|---|---|---|
| 12-month rolling TRIFR | 8.4 | 8.1 | 5.1 | 6.73 | 6.14 |
| Community Support Program (A$m) | 1.4 | 1.8 | 0.8 | 2.1 | see annual report |
The injury-rate metric is not portfolio-wide in a simple ownership sense: the reports describe its scope as Yancoal-operated sites and corporate offices, excluding non-operated HVO and Middlemount. The FY2024 annual report records the death of a contractor during Austar closure activities in September 2024 and says the regulator investigation was ongoing at that report date. No cause, legal responsibility, compliance conclusion or outcome is inferred here.
The FY2021 report listed Scope 1 and 2 operational-control emissions of 2.08MtCO2-e for the year ended 30 June 2021. FY2024 reported 1,819,649 tCO2-e Scope 1 and 266,753 tCO2-e Scope 2, or 2,086,402 tCO2-e in total, with a stated operational-control boundary. FY2025’s sustainability disclosure reports 3,073,231 tCO2-e Scope 1 and 351,689 tCO2-e location-based Scope 2 within its stated boundary. The FY2025 report also notes significant measurement uncertainty and comparability limitations in greenhouse-gas measurement. These periods and boundaries should not be combined without that qualification.
The FY2025 report says the company had not set voluntary climate/emissions-reduction targets. It describes statutory Safeguard Mechanism obligations for six mines. After FY2025 Section 19 reporting, it records aggregate 830,661 tCO2-e carbon liability for Ashton, Warkworth and Yarrabee and states that ACCUs would be surrendered by 1 April 2026; Moolarben was reported below its baseline and generated 39,794 SMCs. This is a statutory-reporting record, not a conclusion on future compliance or emissions.
Environmental and closure items remain status-qualified. The reports describe water storage, pumping, segregation and preparedness controls; independent environmental assurance audits; rehabilitation provisions; and closure planning for Austar and Stratford Duralie. FY2025 discloses A$1.065bn of contingent bank guarantees/surety bonds, including A$685m for statutory restoration-cost guarantees for owned and managed mines. A guarantee, audit, plan or provision does not itself demonstrate a future outcome.
Section sources. Yancoal Australia FY2021 Annual Report, “Sustainability” and “Management Discussion and Analysis”; Yancoal Australia FY2022 Annual Report, “Sustainability” and “Management Discussion and Analysis”; Yancoal Australia FY2023 Annual Report, “Sustainability” and “Management Discussion and Analysis”; Yancoal Australia FY2024 Annual Report, “Safety, Sustainability and People” and “Financial Statements”; Yancoal Australia FY2025 Full Year Financial Report, “Safety, Sustainability and People”, “Sustainability Report” and “Management Discussion and Analysis”.
18
17. Governance, workforce, risk and accounting judgements
The FY2025 report identifies Board committees including Audit and Risk Management, Health, Safety, Environment and Community, Nomination and Remuneration, and Strategy and Development. The FY2024 annual report reports about 3,689 FTE employees at 31 December 2024, all in Australia; it excludes contract labour, contractors and HVO employees from that employee count. Governance structures and workforce statistics are snapshots of the relevant reporting period.
Across the five reports, the company’s risk disclosures include coal-price and demand conditions, foreign exchange, interest rates, credit and liquidity, weather and transport infrastructure, health and safety, regulatory approvals, closure and rehabilitation, cyber security, people, joint ventures and third-party reliance, resources/reserves and geology, impairment, and climate/transition matters. Listing a risk does not state its likelihood, priority, realised outcome or financial effect.
The FY2024 financial statements identify resources/reserves, coal price, exchange rates, production/sales, costs, capital, closure/rehabilitation and commodity-related assumptions as inputs to impairment assessment; they describe uncertainty in those estimates. The FY2021 report also presents scenario sensitivities for particular cash-generating units. Such company disclosures are accounting assumptions or sensitivities, not forecasts, valuation conclusions or investment advice.
At 31 December 2025, provisionally priced sales remaining to finalise were reported at A$159m; the report’s 10% price sensitivity was A$16m. It also identifies currency, price, interest-rate, credit and liquidity risks. These figures are point-in-time disclosures and sensitivity illustrations, not future price guidance.
Section sources. Yancoal Australia FY2021 Annual Report, “Financial Risk” and impairment notes; Yancoal Australia FY2022 Annual Report, “Corporate Governance Statement” and financial-risk notes; Yancoal Australia FY2023 Annual Report, “Corporate Governance Statement” and financial-risk notes; Yancoal Australia FY2024 Annual Report, “Corporate Governance Statement”, impairment and financial-risk notes; Yancoal Australia FY2025 Full Year Financial Report, “Corporate Governance Statement” and “Management Discussion and Analysis”.
19
18. Complete asset register, methodology and important notice
18.1 Portfolio register — annual-report status at FY2025
| Asset / complex | FY2025 annual-report status | Ownership / accounting distinction where stated |
|---|---|---|
| Moolarben | Owned and operated; open cut and underground | 98.75% at 31 December 2025 |
| Mount Thorley / Warkworth (MTW) | Owned and operated complex | 80% Mount Thorley / 84.47% Warkworth in resource table |
| Hunter Valley Operations (HVO) | Jointly owned operating open-cut complex | 51%; not operated by Yancoal for TRIFR boundary |
| Yarrabee | Owned and operated open-cut complex | 100% |
| Ashton / RUMEx | Owned and operated underground-related reporting asset | 100% |
| Middlemount | Jointly owned operating complex | 50%; equity-accounted production/result |
| Austar | Mine closure | Not presented as operating output |
| Stratford Duralie | Mine closure | Mining completed in FY2024; no FY2025 output |
| Donaldson | Care and maintenance / legacy accounting and rehabilitation items | Not presented as current operating output |
| Cameby Downs and Premier Coal | Operated for majority shareholder | Managed mines; do not treat as Yancoal-owned production |
18.2 Method and use limits
This factual record was built from the five linked Yancoal annual reports for FY2021–FY2025. It reorganises reported figures into a company-specific record and uses independent wording and reconstructed tables. It does not reproduce source graphics, maps, narrative passages or table layouts. Every number remains subject to its original reporting date, accounting/ownership basis, definition and rounding.
No AI-generated image is included in this report. If an AI-generated visual is added in a later edition, it must be identified next to the image.
AI-assisted factual record and important notice. This report was prepared with active use of artificial-intelligence systems for source extraction, comparison, calculation support, translation, drafting and explanatory presentation. The systems may introduce errors, omissions, mistranslations, misclassification or inconsistencies. MII performs a reasonable review before publication, but does not independently audit every underlying source or guarantee accuracy, completeness, currency or fitness for any purpose. This material is provided solely for general informational and educational purposes. It is not financial, investment, legal, tax or other professional advice; it does not recommend or solicit any transaction in any security; and it contains no price target, valuation or forecast. Readers must verify material information directly with the original issuer documents and obtain independent professional advice before acting. To the maximum extent permitted by applicable law, MII and its contributors disclaim liability for loss arising from use of or reliance on this material. Nothing in this notice excludes, restricts or modifies any liability that cannot lawfully be excluded, restricted or modified.
18.3 Primary issuer sources
- Yancoal Australia FY2021 Annual Report
- Yancoal Australia FY2022 Annual Report
- Yancoal Australia FY2023 Annual Report
- Yancoal Australia FY2024 Annual Report
- Yancoal Australia FY2025 Full Year Financial Report
Section sources. Yancoal Australia FY2021 Annual Report, “Business Overview”; Yancoal Australia FY2022 Annual Report, “Management Discussion and Analysis”; Yancoal Australia FY2023 Annual Report, “Management Discussion and Analysis”; Yancoal Australia FY2024 Annual Report, “Business Overview” and “Coal Resources and Coal Reserves”; Yancoal Australia FY2025 Full Year Financial Report, “Business Overview”, “Management Discussion and Analysis” and “Coal Resources and Coal Reserves”.
20
Public discussion
Comments
Verified members' comments appear immediately. Market manipulation, unverified inside information, impersonation, financial solicitation, referral links, personal data and abusive content may be blocked. Signed-in members can report a published comment for review.
No published comments yet.