ASX COMPANY FACT RECORD
Scentre Group — portfolio, operations and development record
Westfield portfolio operations, customer activity, developments, financing and distributions.
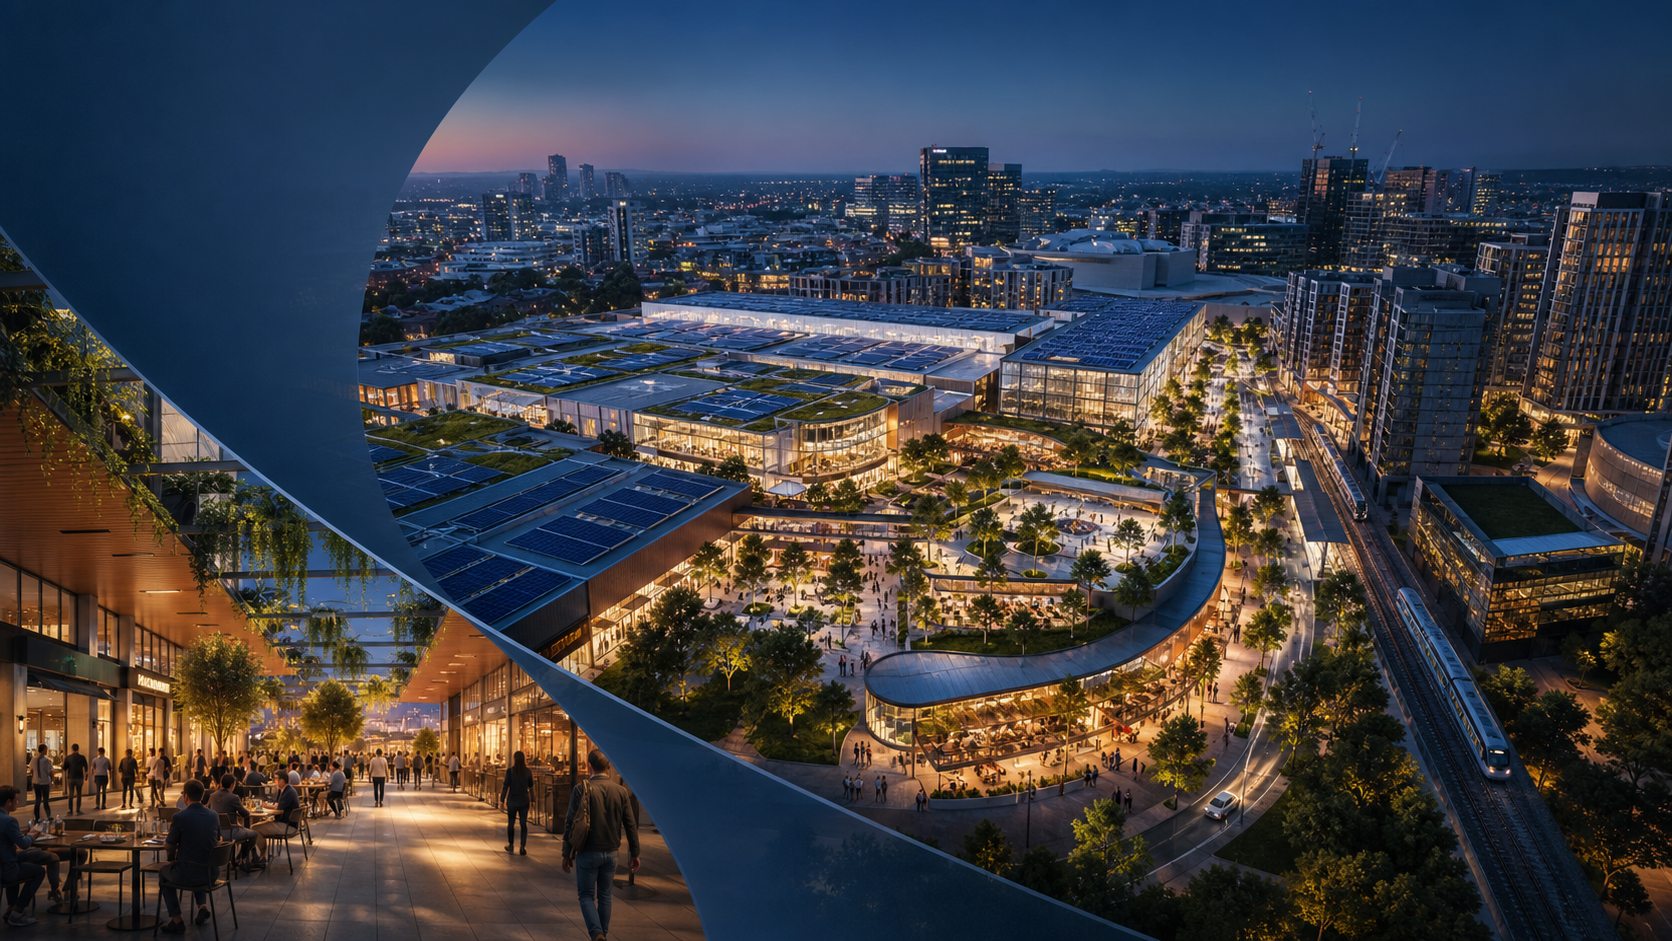
01
Research scope
Research form: source-led factual company, asset and project record; no valuation, target price, trading view or investment recommendation. Company / listing: Scentre Group, ASX: SCG. Reporting currency: Australian dollars unless a source expressly states otherwise. Fiscal-year basis: FY2021–FY2025; each period ended 31 December. Primary reporting cut-off: the FY2025 Annual Report, issued 24 February 2026, covering the year ended 31 December 2025. Later events are labelled as such, rather than folded into FY2025. Method: annual-report and Property Compendium sections were read across all five periods; information below is selected, compared and reorganised from the linked public issuer documents.
> Reading rule. Figures, labels and asset interests in Scentre reporting can use different perimeters. This report keeps those perimeters visible. A stated fact is not a valuation opinion, forecast, causal claim or recommendation.
02
1. Identity, stapled-group reporting boundary and five-year scope
Scentre Group is reported as a stapled group, not as a single ordinary-share property company. A quoted Scentre security comprises one share in Scentre Group Limited and one unit in each of Scentre Group Trusts 1, 2 and 3; the four interests trade together. The financial-reporting parent is Scentre Group Limited. This legal and accounting description is important, but it does not determine the economic interest in any individual Westfield destination.
For FY2021–FY2025 (each year ended 31 December), Scentre described its operating platform as an owner, operator, manager and developer of retail property assets in Australia and New Zealand. The terminology changed from “Westfield Living Centres” in the FY2021 material to “Westfield destinations” in later reporting; the disclosed estate count remained 42. FY2025’s annual report, issued on 24 February 2026, covers the 12 months to 31 December 2025, rather than activity in 2026.
Measures that must not be merged
The annual reports and Property Compendiums use several different portfolio boundaries. They are retained separately throughout this report.
| Reported measure | What it represents in Scentre reporting | Do not substitute it for |
|---|---|---|
| Assets under management (AUM) | Managed-platform measure, including the Group’s interest and third-party interests. | A centre’s book value, consolidated accounting assets, or SCG’s economic interest in an asset. |
| SCG share of AUM / Group investment | Scentre’s stated share of the managed platform. | Gross AUM, a Property Compendium total, or statutory consolidated assets. |
| Property Compendium ownership interest | Centre-by-centre economic interest shown in the portfolio schedule. | A uniform accounting, control or management conclusion. |
| Property Compendium total portfolio book value | The compendium’s stated property-portfolio basis. | AUM or the statutory balance sheet. |
| Consolidated and equity-accounted interests | Financial-report accounting treatment. | A simple “100% versus 50%” ownership classification. |
| Retail GLA, tenants, visits and sales | Operating measures, each on the issuer’s stated portfolio/period basis. | Asset value, AUM or income. |
The FY2025 annual report gives the following five-year AUM and SCG-share record. These are management presentation measures; they should not be read as a series of statutory total assets or a sum of individual property values.
| Year ended 31 December | AUM (A$bn) | SCG share of AUM (A$bn) |
|---|---|---|
| 2021 | 50.4 | 34.4 |
| 2022 | 51.2 | 35.0 |
| 2023 | 50.2 | 34.3 |
| 2024 | 50.2 | 34.7 |
| 2025 | 51.2 | 34.0 |
At FY2021, Scentre separately described $16.0bn of third-party funds; at FY2022 it described $16.2bn of third-party funds alongside $35.0bn of Group investment. These disclosures illustrate why the Group’s share and the total managed platform must stay distinct. For FY2023, the annual report described $50.2bn AUM as a $34.3bn SCG investment and $15.9bn third-party funds. The FY2024 suite separately reported $50.2bn AUM, $34.7bn SCG share of AUM, $34.245bn Property Compendium total-portfolio value and, in its segment reconciliation, $31.610bn consolidated shopping-centre investments plus $2.635bn equity-accounted interests. At 31 December 2025, the Group reported 42 destinations, $51.2bn AUM and $34.0bn SCG share of AUM.
Section 1 sources — issuer documents and printed pages.
- Scentre Group 2021 Annual Financial Report, pp. 2–3, 6–9.
- Scentre Group 2022 Annual Financial Report, pp. 2, 10, 23.
- Scentre Group 2023 Annual Financial Report, pp. 3, 22, 82–86.
- Scentre Group 2024 Annual Report, pp. 8, 12–13, 23, 94, 99, 144–145.
- Scentre Group 2025 Annual Report, pp. 8–9, 12–13, 23, 187.
03
2. The Westfield destination estate: complete portfolio, geography and ownership basis
Estate scope and five-year continuity
The five Property Compendiums record 42 destinations at each 31 December reporting date: 37 in Australia and five in New Zealand. Inclusion in a yearly portfolio table records that a destination was part of Scentre’s reported estate at that date; it is not proof that the centre was wholly owned. The FY2025 portfolio schedule reports two ACT, 15 NSW, six Queensland, three South Australian, seven Victorian, four Western Australian and five New Zealand destinations.
At 31 December 2025, the Property Compendium reported 3.901m sqm retail GLA, 11,587 tenants, 540.1m annual visits and A$33.667bn total portfolio book value on its stated portfolio basis. The New Zealand rows in that schedule are denominated in NZD; the compendium supplies its own stated translation basis for the total. This total portfolio book value is not the Group’s $51.2bn AUM. The same FY2025 material reports more than 670 hectares of land holdings, including 169ha NSW, 179ha Victoria, 127ha Queensland, 78ha Western Australia, 65ha South Australia, 54ha New Zealand and 17ha ACT. Land holdings are not a measure of delivered development or retail GLA.
Complete destination register at 31 December 2025
Every row below was listed in the Property Compendium’s portfolio tables in FY2021, FY2022, FY2023, FY2024 and FY2025. “50%” and “51%” are the issuer’s reported economic-interest fields. They do not by themselves establish identical governance or accounting treatment. In particular, the FY2025 annual report identifies Mt Druitt, Southland and Tea Tree Plaza as equity-accounted Australian shopping-centre investments, while other 50%-owned interests can have different accounting treatment. Scentre’s disclosed property, leasing and development-management roles are also separate from ownership.
| Destination and location | FY21–FY25 register status | FY2025 ownership / co-owner boundary | FY2025 retail GLA (sqm) | FY2025 profile page |
|---|---|---|---|---|
| Westfield Airport West, VIC | Listed throughout; 50% throughout | Scentre 50%; Perron 50% | 52,900 | 15 |
| Westfield Albany, NZ | Listed throughout; 51% throughout | Scentre 51%; GIC 49% | 53,300 | 16 |
| Westfield Belconnen, ACT | Listed throughout; 100% throughout | Scentre 100% | 95,500 | 17 |
| Westfield Bondi Junction, NSW | Listed throughout; 100% throughout | Scentre 100% | 131,202 | 18 |
| Westfield Booragoon, WA | Listed throughout; 50% throughout | Scentre 50%; DWPF 50% | 72,385 | 19 |
| Westfield Burwood, NSW | Listed throughout; 50% throughout | Scentre 50%; Perron 50% | 63,240 | 20 |
| Westfield Carindale, QLD | Listed throughout; 50% property-trust interest throughout | Carindale Property Trust 50%; APPF 50%; SCG held 66.9% of CDP at FY25 | 136,020 | 21 |
| Westfield Carousel, WA | Listed throughout; 100% throughout | Scentre 100% | 109,747 | 22 |
| Westfield Chatswood, NSW | Listed throughout; 100% throughout | Scentre 100% | 81,600 | 23 |
| Westfield Chermside, QLD | 100% FY21–FY24; 50% FY25 | Scentre 50%; DWSF 25%; DSIT 25% | 176,428 | 24 |
| Westfield Coomera, QLD | Listed throughout; 50% throughout | Scentre 50%; QIC 50% | 57,900 | 25 |
| Westfield Doncaster, VIC | Listed throughout; 50% throughout | Scentre 50%; M&G Asia Property Fund 25%; ISPT 25% | 123,100 | 26 |
| Westfield Eastgardens, NSW | Listed throughout; 50% throughout | Scentre 50%; Terrace Tower Group 50% | 82,977 | 27 |
| Westfield Fountain Gate, VIC | Listed throughout; 100% throughout | Scentre 100% | 173,200 | 28 |
| Westfield Geelong, VIC | Listed throughout; 50% throughout | Scentre 50%; Perron 50% | 52,000 | 29 |
| Westfield Helensvale, QLD | Listed throughout; 50% throughout | Scentre 50%; IP Generation 50% | 44,900 | 30 |
| Westfield Hornsby, NSW | Listed throughout; 100% throughout | Scentre 100% | 98,128 | 31 |
| Westfield Hurstville, NSW | Listed throughout; 50% throughout | Scentre 50%; DWPF 50% | 61,000 | 32 |
| Westfield Innaloo, WA | Listed throughout; 100% throughout | Scentre 100% | 47,200 | 33 |
| Westfield Knox, VIC | Listed throughout; 50% throughout | Scentre 50%; T Corp 50% | 141,390 | 34 |
| Westfield Kotara, NSW | Listed throughout; 100% throughout | Scentre 100% | 80,800 | 35 |
| Westfield Liverpool, NSW | Listed throughout; 50% throughout | Scentre 50%; DWSF 50% | 82,962 | 36 |
| Westfield Manukau, NZ | Listed throughout; 51% throughout | Scentre 51%; GIC 49% | 44,777 | 37 |
| Westfield Marion, SA | Listed throughout; 50% throughout | Scentre 50%; Cuscaden Peak Investments 50% | 138,300 | 38 |
| Westfield Miranda, NSW | Listed throughout; 50% throughout | Scentre 50%; DWPF 50% | 128,800 | 39 |
| Westfield Mt Druitt, NSW | Listed throughout; 50% throughout | Scentre 50%; DWPF 50%; equity-accounted boundary | 65,400 | 40 |
| Westfield Mt Gravatt, QLD | Garden City FY21; reported as Mt Gravatt FY22–FY25; 100% throughout | Scentre 100% | 141,700 | 41 |
| Westfield Newmarket, NZ | Listed throughout; 51% throughout | Scentre 51%; GIC 49% | 86,800 | 42 |
| Westfield North Lakes, QLD | Listed throughout; 50% throughout | Scentre 50%; DWPF 50% | 115,023 | 43 |
| Westfield Parramatta, NSW | Listed throughout; 50% throughout | Scentre 50%; GIC 50% | 140,104 | 44 |
| Westfield Penrith, NSW | Listed throughout; 50% throughout | Scentre 50%; GPT 50% | 91,705 | 45 |
| Westfield Plenty Valley, VIC | Listed throughout; 50% throughout | Scentre 50%; DWPF 50% | 63,405 | 46 |
| Westfield Riccarton, NZ | Listed throughout; 51% throughout | Scentre 51%; GIC 49% | 54,993 | 47 |
| Westfield Southland, VIC | Listed throughout; 50% throughout | Scentre 50%; DWSF 50%; equity-accounted boundary | 129,333 | 48 |
| Westfield St Lukes, NZ | Listed throughout; 51% throughout | Scentre 51%; GIC 49% | 39,800 | 49 |
| Westfield Sydney, NSW | Listed throughout; 100% at each FY21–FY25 balance date | Scentre 100% at 31 Dec 2025; a later 19.9% sale settled 3 Feb 2026 | 97,453 | 50 |
| Westfield Tea Tree Plaza, SA | Listed throughout; 50% throughout | Scentre 50%; TTOT 50%; equity-accounted boundary | 99,200 | 51 |
| Westfield Tuggerah, NSW | Listed throughout; 100% throughout | Scentre 100% | 85,070 | 52 |
| Westfield Warringah Mall, NSW | Listed throughout; 50% throughout | Scentre 50%; DWPF 50% | 131,900 | 53 |
| Westfield West Lakes, SA | Listed throughout; 50% throughout | Scentre 50%; WLOT 50% | 71,439 | 54 |
| Westfield Whitford City, WA | Listed throughout; 50% throughout | Scentre 50%; JY Group 50% | 85,063 | 55 |
| Westfield Woden, ACT | Listed throughout; 50% throughout | Scentre 50%; Perron 50% | 72,752 | 56 |
Five-year changes and dated ownership boundaries
- FY2021: the 42-centre inventory used the name *Garden City* for the Queensland destination subsequently labelled Westfield Mt Gravatt. That is a reporting/name boundary, not evidence of an acquisition or disposal.
- FY2022: the Property Compendium used Westfield Mt Gravatt for the same destination; the estate remained at 42 destinations.
- FY2023: the estate remained at 42 destinations. The compendium continued to show the asset-level mix of 100%, 50% and New Zealand 51% interests. It recorded Carindale as a 50%-owned property-trust interest; the annual-report property note disclosed Scentre’s 65.17% interest in CPT at that date.
- FY2024: the 42-destination scope continued. The annual report described the June 2024 Tea Tree Opportunity Trust capital-partnership transaction; the 50% Tea Tree Plaza asset interest should be read with the related accounting and management disclosures rather than as a generic asset acquisition.
- FY2025: Scentre sold 25% interests in Westfield Chermside in July and December 2025, retaining 50% and the stated property, leasing and development-management roles. The annual report’s financial-statement note records $1,366.1m consideration for the 50% Chermside sale. Westfield Sydney was still shown at 100% at the 31 December 2025 balance date. Its 19.9% interest sale settled on 3 February 2026, so it is a subsequent-event update, not an FY2025 closing ownership percentage.
Section 2 sources — issuer documents and printed pages.
- Scentre Group 2021 Property Compendium, pp. 1, 6, 8–49; 2021 Annual Financial Report, pp. 97–98.
- Scentre Group 2022 Property Compendium, pp. 1, 6, 8–49.
- Scentre Group 2023 Property Compendium workbook, worksheet Property Compendium Data, columns A–AD, rows 7–48. This issuer-hosted XLSX has no printed PDF pages; the worksheet/row locator is supplied instead. 2023 Annual Financial Report, pp. 82–86.
- Scentre Group 2024 Property Compendium, pp. 1–2, 13, 15–56; 2024 Annual Report, pp. 8–9, 20–21, 99.
- Scentre Group 2025 Property Compendium, pp. 1–2, 13, 15–56; 2025 Annual Report, pp. 8–9, 22, 128, 135–136.
04
3. Customers, visitation, business-partner sales and Westfield membership
Five-year record and reporting boundaries
Scentre Group reports customer visits and business-partner sales across its Westfield destination platform. These are portfolio measures. Westfield membership, customer advocacy (NPS), centre-event activity, leasing activity and property income measures are related but separately reported measures; none is used here as proof that another caused it. All periods below are years ended 31 December.
| Year | Customer visits | Business-partner sales | Westfield membership / customer measure | Customer-activity record and boundary |
|---|---|---|---|---|
| FY2021 | 413m | A$22.1bn | 2.2m members; NPS 38 | The Group reported more than 13,500 centre events, including 2,100 cultural, community and sustainability initiatives. It said COVID-19 lockdowns/restrictions in NSW, Victoria, the ACT and Auckland affected sales and visits, and disclosed 81 portfolio-weighted government-restricted trading days (2020: 31). Those are issuer-described operating conditions, not an attribution of the annual result to any one factor. |
| FY2022 | 480m in the Annual Financial Report | A$26.7bn | More than 3.2m members; NPS 40, up 2 points | More than 15,400 centre events were reported, of which 3,500 were cultural, community or sustainability initiatives. The Group reported six destinations with more than A$1bn annual sales: Chermside, Bondi Junction, Fountain Gate, Sydney, Miranda and Carindale. |
| FY2023 | 512m | A$28.4bn | More than 3.8m members, +640,000; NPS 46, +6 points | The report described a 24,000-member customer research community and 20 free Live Nation performances. It reported 3,700 businesses across about 12,000 outlets; approximately 45% of stores were described as experience-based. |
| FY2024 | 526m | A$29.0bn | 4.5m members, +0.7m; NPS 49, +3 points | The Group reported more than 22,000 events, including more than 4,000 community and cultural events. Olympic Live Sites/Fan Zones had more than 900,000 attendees. The dated Westfield Bondi attack is recorded separately below rather than used to explain portfolio sales, visits, NOI or value. |
| FY2025 | 540m, +14m / +2.7% | A$30.0bn, +A$1.0bn / +3.6% | 5.0m registered customers, +11%; NPS 56, +7 points | The Group reported more than 21,000 cultural/community events and engagement initiatives; approximately 1,200 businesses entered through media and retail pop-ups, and about 40 transitioned to long-term stores. These are reported programme activities, not a demonstrated financial-return calculation. |
Visit-count rounding and source treatment
The FY2022 Annual Financial Report presents 480m customer visits, while the FY2022 Property Compendium’s total-portfolio row gives 479.6m. The report uses 480m in the five-year comparison table because it is the Annual Financial Report’s rounded whole-platform annual figure; 479.6m is retained here as the Property Compendium’s one-decimal total-portfolio presentation rather than recast as a contradiction or silently substituted. A comparable formatting difference appears in FY2024: the Annual Report presents 526m visits and the Property Compendium gives 525.9m. The issuer materials reviewed do not state that these pairs use different scopes; the report therefore labels the document and precision used for each figure and does not derive an adjusted series.
FY2021: restrictions, operating continuity and platform activity
For FY2021, Scentre reported 413m visits and A$22.1bn annual sales. It described all Westfield Living Centres as remaining open under COVID-Safe protocols while also reporting the government-restricted trading days and the affected jurisdictions. Westfield Plus membership reached 2.2m, an increase of 1.6m in the year, and NPS was 38. The Group also reported that Westfield Direct had been launched across all 37 Australian centres in the fourth quarter: more than 150 business partners had joined, Australian centres operated as distribution hubs, and more than half of orders used click-and-collect. These are reported platform-rollout and customer-engagement facts, not a quantified contribution to sales or rent.
FY2022: annual traffic/sales record, membership and centre activity
The FY2022 Annual Financial Report reported 480m visits, 67m above FY2021, and A$26.7bn business-partner sales, 21.0% above FY2021. Westfield membership exceeded 3.2m after adding more than one million members. The reported NPS was 40; the issuer stated that this comparison excluded Westfield Knox while it was under development. The Group completed more than 15,400 centre events, including 3,500 cultural, community and sustainability engagement initiatives. It also reported an Auslan Santa pilot. Separately, it stated A$21m of community investment over the preceding four years; this is a four-year cumulative disclosure, not an FY2022-only expenditure.
FY2023: visits, sales, research and outlet mix
FY2023 reporting recorded 512m visits, 32m (6.7%) above FY2022, and A$28.4bn business-partner sales, A$1.7bn (6.4%) above FY2022. Westfield membership exceeded 3.8m, up 640,000, while NPS was reported at 46. The annual report describes customer feedback obtained through surveys, social channels and online reviews, as well as a 24,000-member research community. It also records the platform’s 3,700 businesses, approximately 12,000 outlets, and approximately 45% experience-based-store mix. These portfolio descriptions do not form a tenant-by-tenant register.
FY2024: customer activity and the dated Bondi safety record
For FY2024, Scentre reported 526m visits, A$29.0bn sales and 4.5m Westfield members. It reported an NPS of 49, more than 22,000 events, more than 4,000 community/cultural events, and more than 900,000 attendees at Olympic Live Sites/Fan Zones. The annual-report and property-compendium materials describe customer activations, including Disney, Live Nation and Australian/New Zealand Olympic and Paralympic Team partnerships. Those descriptions are company context; this report does not treat them as an independently demonstrated cause of changes in visits or sales.
On 13 April 2024, an attack occurred at Westfield Bondi. The FY2025 Annual Report records six deaths, including a member of the security team, and describes the first anniversary, support and counselling arrangements, and the Bondi Junction Inquest. The event is retained as a dated safety and community fact. The materials reviewed do not support turning it into a portfolio-wide assertion about FY2024 sales, valuations, distributions or net operating income.
FY2025: reported scale and engagement measures
FY2025 reporting gives 540m visits, A$30.0bn business-partner sales, five million registered customers and NPS of 56. The Annual Report identifies 3,700 business partners across 12,000 outlets, with 45% of outlets described as experience-based. It reports more than 21,000 cultural/community events and engagement initiatives, approximately 1,200 businesses entering through media and retail pop-ups, and approximately 40 moving to long-term stores. The Property Compendium additionally reports regional visit totals of 251.2m for NSW, 81.4m for Victoria, 74.6m for Queensland, 44.2m for New Zealand, 37.2m for Western Australia, 31.8m for South Australia and 19.7m for the ACT. Those rounded regional values are not recomputed into a different portfolio total here.
Sources — customers, visits, sales and membership.
- Scentre Group 2021 Annual Financial Report, printed pp. 4–11, including pp. 6–7 for the customer measures; 2021 Property Compendium, printed pp. 1–3.
- Scentre Group 2022 Annual Financial Report, printed pp. 2–5, 8–9, 14–19 and 22–23; 2022 Property Compendium workbook, Portfolio Summary / data worksheet total-portfolio row (479.6m visits; issuer worksheet).
- Scentre Group 2023 Annual Financial Report, printed pp. 4–5, 9 and 14–17.
- Scentre Group 2024 Annual Report, printed pp. 4, 7, 14–18 and 46–48; 2024 Property Compendium, printed pp. 1–2 and 10–13.
- Scentre Group 2025 Annual Report, printed pp. 4–7, 11–12 and 17–20; 2025 Property Compendium, printed pp. 1–2 and 10.
05
4. Business-partner demand, leasing and property operating performance
Five-year leasing and property-performance record
The table deliberately keeps occupancy, deal activity, specialty-lease terms, gross rent collections, property revenue, net operating income (NOI), business-partner sales and FFO separate. The issuer uses different measurement bases across these disclosures. In particular, where disclosed below, property revenue/expenses/NOI are the issuer’s proportionate presentation (including equity-accounted entities on a gross basis); gross rent collection is a cash-collection measure; and FY2025 like-for-like NOI growth has stated exclusions.
| Year | Occupancy at 31 Dec | Lease-deal record | Specialty lease terms disclosed | Gross rent collected | Property revenue / expenses / NOI (issuer basis) | Comparability and boundary |
|---|---|---|---|---|---|---|
| FY2021 | 98.7% | 2,497 deals; 1,090 new-merchant deals; 267 new brands | Not separately captured for a comparable portfolio-wide lease-spread/rent-escalation series | A$2.258bn | Not set out in the selected five-year comparative lane | 99% of FY2021 rental income was reported as contracted base rent. Pandemic-affected sales/visits and an expected credit charge are not re-labelled as occupancy, rent or NOI. |
| FY2022 | 98.9% | 3,409 deals: 2,232 renewals and 1,177 new-merchant deals; 288 new brands | The selected report lane describes contractual escalations and CPI-linked long-term lease commitments, but does not separately give a comparable universal spread/escalation number | A$2.592bn | Revenue A$2.3739bn; expenses A$581.0m; NOI A$1.7929bn | NOI amounts are the proportionate/non-IFRS bridge. Expected COVID-19 credit charge: A$14.3m (FY2021: A$168.8m), not a rental or NOI measure. |
| FY2023 | 99.2% | 3,273 deals; 307 new brands | New specialty lease spreads +3.1%; average specialty rent escalations +7.5% | A$2.723bn; 103% of gross rental billings | Revenue A$2.5284bn; expenses A$577.7m; NOI A$1.9507bn | Specialty measures are not asserted to apply identically at each centre. The 2023 NOI comparison is A$1.7929bn on the corresponding FY2022 proportionate basis. |
| FY2024 | 99.6% | 3,253 deals: 2,077 renewals and 1,176 new merchants | New specialty lease spreads +2.0%; average specialty-rent escalations +5.2% | A$2.821bn, +A$98m | Revenue A$2.6438bn; expenses A$614.3m; NOI A$2.0295bn | Proportionate FFO bridge. Property Compendium measures separately show average specialty-store rent A$1,888/sqm and specialty sales MAT of A$12,500/sqm for stores under 400 sqm. |
| FY2025 | 99.8% | 3,090 deals; more than 1,000 new business partners onboarded | New specialty lease spreads +3.2%; average specialty rent escalations +4.5% | A$2.905bn; 100.3% of billings | The CEO review reports like-for-like NOI growth of 4.8% | The 4.8% measure explicitly excludes the partial Westfield Chermside divestment and release of the Expected Credit Charge. It is not a whole-portfolio statutory-income growth rate. |
Occupancy, lease activity and contractual-rent disclosures
Portfolio occupancy rose in the reported year-end series from 98.7% in FY2021 to 99.8% in FY2025. The figure is portfolio occupancy at each 31 December date. It is neither a same-centre sales measure, a lease-expiry measure nor a property-valuation measure. Scentre reported 2,497 lease deals in FY2021, 3,409 in FY2022, 3,273 in FY2023, 3,253 in FY2024 and 3,090 in FY2025. Deal counts include different deal categories where separately disclosed; they must not be interpreted as a count of new outlets alone.
The annual reports expressly give specialty lease metrics in FY2023–FY2025. FY2023 reported +3.1% new specialty lease spreads and 7.5% average specialty-rent escalations; FY2024 reported 2.0% and 5.2%; FY2025 reported 3.2% and 4.5%. The evidence used here does not supply an equivalent historical metric for FY2021 or FY2022, so the table states “not separately captured” rather than manufacturing a five-year series. Nor are specialty-lease terms applied to all rent, tenants or individual destinations.
Property Compendium disclosures provide additional structural context. In FY2021, the Group said the portfolio had been more than 98% leased for more than 20 years and that 99% of rental income was contracted base rent. FY2024 and FY2025 compendiums also reported 99% contracted base rent. This describes the stated income composition for each year, not a forecast or guarantee of future occupancy, collections or rent escalation.
Gross rent collections versus revenue and NOI
Gross rent collections were reported as A$2.258bn in FY2021, A$2.592bn in FY2022, A$2.723bn in FY2023, A$2.821bn in FY2024 and A$2.905bn in FY2025. The FY2023 and FY2025 reports additionally described collection as 103% and 100.3% of billings respectively. This report keeps those cash-collection figures separate from property revenue, NOI, FFO and statutory profit.
For the issuer’s proportionate financial-performance bridge, FY2022 reported property revenue of A$2.3739bn, property expenses of A$581.0m and NOI of A$1.7929bn. FY2023 reported A$2.5284bn revenue, A$577.7m expenses and A$1.9507bn NOI. FY2024 reported A$2.6438bn revenue, A$614.3m expenses and A$2.0295bn NOI. The FY2024 bridge is explicitly a proportionate basis presentation including equity-accounted entities on a gross basis and is stated unaudited by the auditor. These values should not be mixed with a consolidated accounting property-revenue line, retail sales or cash collections.
FY2025 reports 4.8% like-for-like NOI growth, but the CEO review specifies that this excludes the partial divestment of Westfield Chermside and the release of the Expected Credit Charge. The report retains those exclusions rather than treating 4.8% as an unqualified total-portfolio NOI growth rate. Likewise, the FY2022 expected COVID-19 credit charge of A$14.3m and FY2021 comparator of A$168.8m belong to the FFO bridge; they are neither rental income nor an occupancy metric.
Lease maturity, tenant and concentration measures
The property-compendium measures are an additional leasing-information lane and retain their stated basis. In FY2021, Scentre reported a portfolio WALE of 5.9 years and 393,498 sqm covered by lease deals. It reported that anchor retailers represented 50.3% of GLA and 17% of rental income, with 282 anchor stores, 1.8962m sqm GLA and an 8.2-year average lease term remaining. The same compendium said no single anchor tenant accounted for more than 3% of rental income and no specialty retailer more than 2%.
In FY2024, the Property Compendium reported a 5.3-year portfolio WALE and 503,191 sqm covered by completed deals. Its anchor table reported 286 stores, 1.873m sqm (49.9% of retail GLA) and a 7.1-year average lease term remaining. It separately reported 99% contracted base rent; its ten highest-valued retail centres represented 58% of the portfolio; no single anchor business partner contributed more than 3% of rental income and no specialty business partner more than 2%.
For FY2025, the compendium reported average specialty-store rent of A$1,933 per sqm, average specialty-store sales of A$1.904m, and specialty sales MAT of A$12,901 per sqm for stores under 400 sqm. It reported 288 anchor stores, 1.861m sqm and a 6.3-year average lease term remaining; anchors represented 49.5% of GLA and 15.5% of rental income. The same source states that the ten highest-valued centres represented 56% of the portfolio, with no single anchor business partner above 3% of rental income, no specialty business partner above 2%, and no parent group above 4%. These are stated concentration and operating metrics, not issuer or MII credit ratings.
Sources — business-partner demand, leasing and operating performance.
- Scentre Group 2021 Annual Financial Report, printed pp. 4–5 and 10–11; 2021 Property Compendium, printed pp. 3–5.
- Scentre Group 2022 Annual Financial Report, printed pp. 4–5, 8–9, 16–17 and 22–23; 2022 Property Compendium workbook, operating-performance / lease-data worksheet rows as labelled by the issuer.
- Scentre Group 2023 Annual Financial Report, printed pp. 4–5, 9, 16, 22–23, 84 and 121.
- Scentre Group 2024 Annual Report, printed pp. 4, 7, 18 and 34; 2024 Property Compendium, printed pp. 1 and 10–12.
- Scentre Group 2025 Annual Report, printed pp. 5 and 18; 2025 Property Compendium, printed pp. 1 and 10–12.
Integration controls retained for assembly
- The report’s five-year visit series uses the rounded Annual Financial Report figures: 413m, 480m, 512m, 526m and 540m. Property Compendium one-decimal totals (479.6m in FY2022 and 525.9m in FY2024) remain explicitly disclosed source presentations, not silently overwritten.
- No inference connects COVID restrictions, the Westfield Bondi attack, centre events, membership, store mix, sales, occupancy, NOI, valuation or distributions. Where management describes an activation or customer strategy, it is presented as management description only.
- “NOI” in the FY2022–FY2024 values is the issuer’s proportionate/non-IFRS financial-performance bridge. Gross rent collection, business-partner sales, statutory profit, FFO, tenant count, sales productivity, lease spread and occupancy have distinct definitions and must not be merged.
- The FY2025 4.8% like-for-like NOI measure must carry its exclusions: partial Westfield Chermside divestment and release of the Expected Credit Charge. It must not be relabelled a total-portfolio or statutory measure.
- FY2021–FY2022 specialty lease-spread / average-rent-escalation figures were not separately captured in the source lane used for this section. The absence must remain visible rather than being backfilled from later years.
06
5. Destination reinvestment, space repurposing and retail-development record
Five-year record and status controls
Scentre Group's reports distinguish a completed destination work, a work under construction, a stated future pipeline, and a strategic-asset-planning process. Those states are retained below. In particular, the reported future-development pipeline was more than A$4.5bn in FY2022, more than A$4.0bn in FY2023 and FY2024, and A$4.0bn in FY2025. The reports describe it as future opportunity/pre-development work; it is not a schedule of approved, committed, or completed capital expenditure.
| Reporting period | Destination / work | Issuer-disclosed event and status at that period | Cost and ownership basis where disclosed | Later five-year record / comparability boundary |
|---|---|---|---|---|
| FY2021 | Westfield Knox, VIC | Commenced redevelopment of the former Myer space. The FY2021 report expected staged openings in late 2022 and 2023. | A$355m total investment; no FY2021 SCG-share figure in the cited project passage. | The Level 1 food marketplace opened in December 2022; the final stage opened in November 2023. The library and additional retail experiences were still described as 2024 openings in the FY2023 report. |
| FY2022 | Westfield Knox, VIC | The Level 1 gourmet food marketplace opened in December; remaining retail, swim-school, basketball-court, library, co-working and community elements were reported as staged openings for 2023. | A$355m total; SCG share A$178m. | This was a partly completed, partly in-progress project at FY2022, not a completed whole-centre redevelopment. |
| FY2023 | Westfield Knox, VIC | Final stage opened in November. | A$355m total; SCG share A$178m. | FY2024 Property Compendium describes the redevelopment as completed in 2023 and the community library as opening in early 2024. |
| FY2021 | Westfield Mt Druitt, NSW | Under development at year end; the issuer expected opening in early March 2022. The described scope was rooftop dining, entertainment/leisure, 15 restaurants and indoor/outdoor spaces. | A$55m investment. | Opened in March 2022. It is a historical completion in later compendiums, not FY2021 completion. |
| FY2021 | Westfield Penrith, NSW | Announced/pre-commencement repurposing of former Target space; commencement was stated for January 2022. | A$33m investment. | Completed in November 2022 with casual dining, Coles and an entertainment precinct. |
| FY2022 | Westfield Parramatta, NSW | Fresh-food precinct opened in November. | A$33m investment. | The report names Coles, ALDI and Tong Li supermarket; this is an opening record, not a portfolio-wide leasing measure. |
| FY2023 | Westfield Sydney, NSW | Expansion in progress, planned to introduce 6,000 sqm of luxury retail over five levels, including Chanel, Moncler, Omega and Canada Goose. | No SCG share/cost was stated in the cited passage. | It remained in progress in FY2023; FY2024 expected opening in 2025; FY2025 reports specified retail openings and separately identifies completion/expected completion of adjacent components. |
| FY2021 | 101 Castlereagh Street adjoining Westfield Sydney, NSW | Scentre reported design/construction work on behalf of Cbus Property for an adjoining commercial and residential tower, expected to complete in 2023. | No SCG-owned retail-development cost stated in the cited passage. | The FY2021 disclosure is an adjacent Cbus Property project, not evidence that Scentre completed an SCG-owned retail redevelopment that year. |
| FY2023 | Westfield Mt Gravatt, QLD | Redevelopment commenced to introduce Uniqlo, Harris Scarfe and specialty stores; stores were reported to continue opening through 2024. | A$50m. | FY2024 reports completion and repurposing of more than 14,000 sqm to Harris Scarfe, Powerhouse Gym, Uniqlo, entertainment and other specialty retail. |
| FY2023 | Westfield Tea Tree Plaza, SA | Redevelopment commenced involving JB Hi-Fi, an expanded Timezone and additional dining. | A$27m total; SCG share A$13.5m. | FY2024 reports completion. The later capital partnership is a distinct FY2024 ownership event and is recorded in Section 7. |
| FY2023 | Westfield Bondi Junction, NSW | Planning commenced to repurpose Level 1 of the David Jones space for lifestyle/recreation uses. | No cost was stated in FY2023 cited passage. | Works began in FY2024; Level 1 was completed in FY2025. The later Level 6 project is separately announced/not completed. |
| FY2024 | Westfield Carindale, QLD | Reconfigured food precinct opened. | No project cost disclosed in the cited passage. | Seven new casual-dining experiences were reported, including Betty's Burgers, Nando's and Sushi Juro. |
| FY2024 | Westfield Southland, VIC | Project commenced. | Cost not stated in the FY2024 cited passage. | FY2025 reports a completed A$72m redevelopment, SCG share A$36m, opening a family, dining and entertainment precinct. |
| FY2024 | Westfield Burwood, NSW | Project commenced after department-store space was taken back for Rebel, JB Hi-Fi and ALDI. | Cost not stated in the FY2024 cited passage. | FY2025 reports a completed A$48m redevelopment, SCG share A$24m, welcoming ALDI, JB Hi-Fi, Nike and rebel. |
| FY2024 | Westfield Bondi Junction, NSW | Staged Level 1 works began for Virgin Active and a rebel rCX store; Level 6 lifestyle/dining/entertainment planning was described as well advanced. | No FY2024 cost in the cited passage. | FY2025 reports the Level 1 A$28m redevelopment (SCG share A$28m) complete. It says the Group would commence a separate A$240m Level 6 project; that statement is not evidence of completion. |
| FY2024 | Westfield Chermside, QLD | The issuer described a significant upgrade of the adjacent office precinct: three commercial buildings linked by common walkway/outdoor plaza; Youi secured as major tenant. | No project cost stated in the cited passage. | This operating/office-precinct work is separate from the FY2025 partial sale of the retail destination. |
| FY2025 | Westfield Sydney, NSW | Retail expansion opened with a two-level CHANEL boutique, Moncler and OMEGA. Construction of adjoining commercial space for Cbus Property was reported complete; the residential component was expected to complete in H1 2026. | No project cost stated in the cited passage. | Retail opened, commercial construction completed, and residential expected completion are three different reported states. |
| FY2025 | Portfolio repurposing | The issuer reported that David Jones was strategically downsized at three destinations to unlock space for other stores. | No affected-centre list or project cost was supplied on the cited page. | The report does not support naming three destinations or treating this statement as three completed projects. |
Complete named-project register from the five reviewed annual-report/compendium lanes
The register preserves named historic projects that appear in the five-year source set, including projects completed before FY2021 where later property profiles retain the historical record. It does not assert that this is a register of every maintenance or leasing work across 42 destinations.
| Destination / project | Reported work, use and five-year status | Disclosed cost / SCG share | Ownership or reporting qualification |
|---|---|---|---|
| Airport West | No named development/reinvestment event was separately disclosed in the FY2021–FY2025 annual-report passages reviewed for this section. | Not separately disclosed | Centre remains in the complete estate register; absence here is not zero capital expenditure. |
| Bondi Junction — Level 1 David Jones repurposing | Planning FY2023; works commenced FY2024; completed FY2025 with health, wellness and fitness uses. | A$28m / SCG share A$28m | FY2025 Property Compendium reports SCG 100% interest; project status does not establish a valuation effect. |
| Bondi Junction — Level 6 | FY2024 planning well advanced; FY2025 report says the Group would commence lifestyle, entertainment and dining redevelopment. | A$240m / SCG share not separately stated | Announced/commencement statement only; not completed construction or delivered operating result. |
| Burwood | Commenced FY2024 after department-store-space take-back; completed FY2025. | A$48m / SCG share A$24m | FY2025 Property Compendium reports SCG 50%, Perron 50%; total cost and SCG share must not be interchanged. |
| Carindale | Completed A$50m David Jones consolidation/Kmart introduction recorded as 2020 historic status; food-precinct reconfiguration opened FY2024. | A$50m historic work / FY2024 cost not separately disclosed | Carindale Property Trust owns 50% of centre; SCG held 66.9% of the trust at FY2025. Do not call the FY2024 opening an SCG-100% work. |
| Chermside adjacent office precinct | Significant upgrade completed/reported FY2024; three commercial buildings, common walkway/outdoor plaza and Youi as major tenant. | Not separately disclosed | This is separate from the FY2025 retail-destination ownership transaction. |
| Coomera | First greenfield development, completed 2018; retained as historic property-profile context. | A$470m / not separately stated | FY2021 Property Compendium states 50% SCG/50% QIC. Not FY2021–FY2025 new development spend. |
| Doncaster | Level-2 dining and entertainment redevelopment recorded as completed in 2020. | A$30m / not separately stated | Historic property-profile context; not FY2021 spend. |
| Knox | Commenced FY2021, staged openings FY2022, final stage FY2023; FY2024 property profile says redevelopment completed 2023 and library opened early 2024. | A$355m / SCG share A$178m | Current 50% SCG/Perron interest in FY2025 compendium. |
| Mt Druitt | Under development FY2021; opened March 2022 with rooftop dining, entertainment/leisure and 15 restaurants. | A$55m / not separately stated | Equity-accounted 50% Australian shopping-centre investment in FY2021–FY2025 accounting disclosures. |
| Mt Gravatt | Commenced FY2023; completed FY2024 with more than 14,000 sqm repurposed. | A$50m / SCG share not separately stated | Project text does not provide a separate interest/cost-share basis. |
| Newmarket | Redevelopment completed 2019; retained in FY2021 profile as historic record. | NZ$790m / not separately stated | FY2021 profile stated SCG 51%/GIC 49%; not FY2021–FY2025 new spend. |
| Parramatta | Fresh-food precinct opened November 2022. | A$33m / SCG share not separately stated | FY2025 compendium lists SCG 50%/Paragon REIT 50%. |
| Penrith | Announced FY2021; completed November 2022. | A$33m / SCG share not separately stated | 50% SCG/AMP Wholesale Australian Property Fund in FY2025 compendium. |
| Southland | Commenced FY2024; completed FY2025 with family, dining and entertainment precinct. | A$72m / SCG share A$36m | Equity-accounted 50% Australian shopping-centre investment; no causal claim is made from reported visitation change. |
| Sydney Market/Castlereagh expansion | In progress FY2023–FY2024; retail elements opened FY2025. Adjacent commercial work for Cbus Property completed FY2025; residential expected H1 2026. | Not separately disclosed | Westfield Sydney was 100% at 31 Dec 2025; 19.9% interest later settled on 3 Feb 2026 (Section 7). |
| Tea Tree Plaza | Commenced FY2023; completed FY2024. | A$27m / SCG share A$13.5m | Equity-accounted 50% Australian shopping-centre investment; 50% partner interest introduced in June 2024 (Section 7). |
Section sources.
- Scentre Group 2021 Annual Financial Report, printed pp. 10–11; 2021 Property Compendium, printed pp. 14, 18–19, 28, 34–35, 38.
- Scentre Group 2022 Annual Financial Report, printed pp. 18–19, 26–27; 2022 Property Compendium workbook,
Property Compendium Dataworksheet rows 26, 32 and 36–37. - Scentre Group 2023 Annual Financial Report, printed pp. 4, 9, 16, 18–19, 83, 86 and 122; 2023 Property Compendium, printed pp. 34 and 45.
- Scentre Group 2024 Annual Report, printed pp. 7, 13 and 18–21; 2024 Property Compendium, printed pp. 25, 28, 40 and 45.
- Scentre Group 2025 Annual Report, printed pp. 5 and 20; 2025 Property Compendium, printed pp. 1 and 13–56.
07
6. Strategic land holdings and mixed-use/master-planning pathway
Five-year planning record
The reports place the strategic-land lane alongside, rather than inside, retail redevelopment. FY2021 does not separately present a strategic-land portfolio; FY2022 describes Strategic Asset Planning and pre-development; FY2023 identifies more than 670 hectares and specific early planning; FY2024 reports rezoning at Hornsby and Belconnen; FY2025 adds planning-proposal and authority-process disclosures. Planning permissibility, a lodged proposal, a declared state-significant development and a delivered building are not treated as equivalent stages.
| Reporting period | Asset / platform record | Reported status and disclosed scale | Boundary retained in this report |
|---|---|---|---|
| FY2021 | Strategic land as a distinct disclosure lane | Not separately disclosed in the reviewed FY2021 Annual Financial Report/Property Compendium. The cited operating material instead discusses customer-led development, repurposing and individual projects. | No later residential/master-planning disclosure is backfilled into FY2021. |
| FY2021 | 101 Castlereagh Street adjoining Westfield Sydney | Work for Cbus Property on commercial/residential tower design and construction; completion then expected in 2023. | Adjacent project for Cbus Property; no FY2021 dwelling count, land value or SCG-owned residential-project claim is made. |
| FY2022 | All 42 destinations | Strategic Asset Planning process developed and implemented across 42 centre teams; the Group stated pre-development work continued. | Process/pre-development, not a released asset-by-asset residential register, approval list or committed construction programme. |
| FY2022 | Strategic land / residential | No standalone strategic-land register, dwelling count, master-planning approval, land-bank valuation or project-by-project planning stage separately disclosed in the reviewed annual-report and Property Compendium lanes. | Explicit non-disclosure, not zero. |
| FY2023 | Portfolio land holdings | The Group reported that 42 destinations sat on more than 670 hectares, identifying land holdings as long-term strategic-growth opportunities. | No FY2023 delivered residential/mixed-use pipeline is quantified. |
| FY2023 | Bondi Junction Level 1 | Planning commenced to repurpose current David Jones Level 1 space for lifestyle/recreation. | Retail-space planning, not a residential approval/construction event. |
| FY2023 | All destinations | Each destination's strategic asset plan was reviewed and updated. | The annual report does not separately disclose every plan outcome. |
| FY2024 | Portfolio land holdings | More than 670 hectares located in and around civic and transport hubs, described as having potential to contribute to residential supply. | Potential is not a completed-dwellings outcome. |
| FY2024 | Hornsby, NSW / Belconnen, ACT | The Group reported rezoning approval at both destinations and an opportunity for large-scale residential development. | The reviewed FY2024 material does not separately disclose construction milestones, dwelling delivery or project economics. |
| FY2024 | All destinations | Each destination had a Strategic Asset Plan with short-, medium- and long-term horizons; Scentre said it engaged with governments about relevant planning policy, reforms, legislation and infrastructure. | Platform planning/government engagement, not a list of approvals. |
| FY2025 | Hornsby, NSW | Zoning permissibility received in November 2024 under NSW Transport Oriented Development Program for potential buildings up to 53 storeys and more than 2,100 dwellings. | Permissibility/potential only; no approval, construction or delivery is asserted. |
| FY2025 | Belconnen, ACT | Previously received zoning permissibility for potential buildings up to 28 storeys and more than 2,000 dwellings. | Potential only; no construction/delivery claim. |
| FY2025 | Six unnamed destinations | Planning proposals lodged with relevant authorities, with potential for 16,100 dwellings. | Lodged proposals and potential dwelling count; not authority approval or completed housing. The cited page does not name the six destinations. |
| FY2025 | Warringah, NSW | Declared State Significant Development under the Housing Delivery Authority programme, with potential for 1,500 dwellings. | Declaration/potential, not construction commencement or delivery. |
| FY2025 | Woden, ACT | Six-week community-feedback process completed; concept masterplan refined; Major Plan Amendment submitted to ACT Planning Authority. | The issuer calls this the first step in a long-term staged planning process. Submission is not approval or construction. |
Strategic-land/project register and terminal non-disclosures
| Named item | FY2021–FY2025 record | Status at latest cited point | Not disclosed / do not infer |
|---|---|---|---|
| Westfield Hornsby | FY2024 rezoning approval; FY2025 gives November 2024 zoning-permissibility detail. | Planning/zoning permissibility. | No construction start, project cost, ownership transaction, approved dwelling count or delivered dwellings stated in the cited annual-report lane. |
| Westfield Belconnen | FY2024 rezoning approval; FY2025 repeats zoning permissibility detail. | Planning/zoning permissibility. | No construction start, cost, approval completion or delivery stated in cited lane. |
| Westfield Warringah | FY2025 Housing Delivery Authority declaration. | State Significant Development declaration; 1,500-dwelling potential. | No construction/delivery or capital commitment stated in cited lane. |
| Westfield Woden | FY2025 community consultation, concept refinement and Major Plan Amendment submission. | Submission/early staged planning. | No approval, construction, dwelling delivery or cost stated in cited lane. |
| Westfield Sydney / 101 Castlereagh | FY2021 Cbus Property design/construction disclosure; FY2025 says adjoining commercial construction complete and residential component expected H1 2026. | Commercial complete for Cbus Property; residential expected at report date. | This does not establish an SCG residential development, completed residential component, or strategic-land programme outcome. |
| Six FY2025 proposal destinations | FY2025 reports six proposals and aggregate 16,100-dwelling potential. | Lodged proposals. | Individual destinations, costs, approval statuses and delivery dates were not named on cited page. |
| All 42 destinations | FY2022 Strategic Asset Planning; FY2023 reviewed/updated plans; FY2024 short-/medium-/long-term plans. | Portfolio planning process. | No complete project-by-project masterplan/land-bank valuation table was separately disclosed in the cited annual-report lanes. |
Section sources.
- Scentre Group 2021 Annual Financial Report, printed pp. 10–11; 2021 Property Compendium, printed pp. 1–51.
- Scentre Group 2022 Annual Financial Report, printed pp. 18–19, 26–27 and 94–99; 2022 Property Compendium workbook,
Property Compendium Dataworksheet rows 5–48. - Scentre Group 2023 Annual Financial Report, printed pp. 9, 19 and 27.
- Scentre Group 2024 Annual Report, printed pp. 7–8, 13 and 21; 2024 Property Compendium, printed pp. 1–58.
- Scentre Group 2025 Annual Report, printed pp. 5 and 21.
08
7. Capital partnerships, co-ownership and portfolio changes
Reporting-basis controls
Scentre reports a mixture of wholly owned properties, joint operations and equity-accounted investments. A property-compendium ownership percentage, a gross book value, Group share of AUM, consolidated investment-property carrying value and an accounting equity-method balance are different measures. The tables below retain that separation. A change in ownership percentage is not presented as a valuation movement unless the report separately says so.
Five-year ownership and partnership record
| Period / date | Portfolio or destination event | Ownership / consideration / reported basis | Management and timing boundary |
|---|---|---|---|
| FY2021 | Managed-capital boundary | AUM A$50.4bn; Group share A$34.4bn; A$16.0bn managed for JV partners. | Managed third-party value is not SCG-owned value. |
| FY2021 | Equity-accounted destinations | Mt Druitt, Southland and Tea Tree Plaza: 50% equity-accounted Australian shopping-centre investments. Albany, Manukau, Newmarket, Riccarton and St Lukes: 51% equity-accounted New Zealand investments. | Not every 50%-interest centre has the same accounting treatment; other interests may be consolidated joint operations. |
| FY2021 | Carindale | Carindale Property Trust held 50% of centre; SCG's interest in the trust was 63.09%. | Trust interest and centre interest are different disclosed percentages. |
| FY2021 | Acquisitions/disposals/new partners | No completed acquisition, disposal, new capital partner or centre-ownership change was separately identified in the reviewed AR/PC passages beyond the portfolio ownership information. | Explicit review result, not a statement that no transaction occurred elsewhere. |
| FY2022 | Accounting portfolio boundary | 11 wholly owned centres and 25 jointly owned 50% centres treated as joint operations within A$31.449bn consolidated Australian shopping-centre investments. | Consolidated carrying amount is not total AUM. |
| FY2022 | Equity-accounted investments | Mt Druitt, Southland, Tea Tree Plaza and five NZ centres remained equity accounted; total equity-accounted investments A$2.673bn (A$1.830bn equity and A$843m interest-bearing loans). | The NZ 51% interests were equity accounted because shareholder-agreement resolutions required 75% voting. |
| FY2022 | Carindale | Carindale Property Trust still held 50% centre interest; SCG interest in trust 64.10%. | Do not replace the two percentages with one unsourced effective interest. |
| FY2022 | Portfolio change review | No completed acquisition, disposal or new external capital introduction separately disclosed in the reviewed annual-report passages. | Explicit review result, not zero. |
| FY2023 | Managed-capital boundary | AUM A$50.2bn, comprising A$34.3bn SCG investment and A$15.9bn third-party funds. | AUM is not consolidated assets. |
| FY2023 | Co-ownership/accounting record | The report describes significant co-ownership through unincorporated joint operations and partnerships, trusts or companies accounted for by equity method. Equity-accounted shopping-centre investments were A$2.7414bn within A$33.5583bn proportionate shopping-centre investments. | Centre-level ownership labels are in Property Compendium; book-value changes alone are not transaction evidence. |
| FY2023 | Completed asset change review | No completed asset acquisition/disposal table separately disclosed in the reviewed annual-report passages. | Do not infer a transaction from valuation or ownership-table differences. |
| June 2024 | Westfield Tea Tree Plaza | Tea Tree Opportunity Trust purchased 50%; SCG retained 50%. | A$310m trust-purchase value. Annual report says SCG became co-manager and generated incremental fee income; the disclosure does not by itself establish a change in property/leasing/development management or AUM. |
| September 2024 | Westfield West Lakes | West Lakes Opportunity Trust acquired 50%; SCG retained 50%. | A$175m trust-acquisition value; same co-manager/fee-income qualification. |
| FY2024 | Joint-venture estate | Group reported 16 joint-venture partners across 30 assets. Equity-accounted shopping-centre investments A$2.635bn; total portfolio shopping-centre investments A$34.245bn. | Accounting/economic metrics remain distinct from the individual 50% ownership disclosures. |
| 31 July 2025 and 23 December 2025 | Westfield Chermside | Two Dexus-managed funds acquired 25% each: first interest A$683m in July; second on same terms in December; combined 50% about A$1.3bn. Financial note records A$1,366.1m from 50% sale and A$1,370.3m total investment-property-sale consideration. | Annual report says price was at 30 June 2025 book value and 5.0% capitalisation rate; SCG remained property, leasing and development manager. Transaction occurred within FY2025. |
| FY2025 / 3 February 2026 | Westfield Sydney | Australian Retirement Trust purchased 19.9% for A$864m at a 4.69% valuation capitalisation rate. | At 31 December 2025 the Property Compendium still shows SCG 100%; settlement was 3 February 2026 and was classified as a subsequent event/held-for-sale at year end. SCG remained property, leasing and development manager. |
| FY2025 | Capital introduced | Approximately A$2.2bn of new capital introduced through joint venturing destinations. | Aggregate reported figure; not a substitute for individual consideration, portfolio gross value, Group share of AUM or operating income. |
Current estate ownership register: cross-reference
The complete 42-destination FY2025 ownership/co-owner register and FY2021–FY2025 continuity record appears once in Section 2. The transaction-specific changes—Tea Tree Plaza, West Lakes, Westfield Chermside and Westfield Sydney—are retained in the preceding table. This avoids duplicating asset rows while preserving the full register and every disclosed five-year ownership change.
Section sources.
- Scentre Group 2021 Annual Financial Report, printed pp. 8–9 and 88–91; 2021 Property Compendium, printed p. 6 and property profiles pp. 8–49.
- Scentre Group 2022 Annual Financial Report, printed pp. 94–99; 2022 Property Compendium workbook,
Property Compendium Dataworksheet rows 7–48 andPortfolio Summaryworksheet rows 4–69. - Scentre Group 2023 Annual Financial Report, printed pp. 3, 86 and 116; 2023 Property Compendium workbook,
Property Compendium Dataworksheet rows 7–48. - Scentre Group 2024 Annual Report, printed pp. 7, 13, 22 and 94, 99–100; 2024 Property Compendium, printed p. 13.
- Scentre Group 2025 Annual Report, printed pp. 3, 5, 22 and 135–136; 2025 Property Compendium, printed p. 13 and property profiles pp. 15–56.
Disclosure limits retained
- No reported A$4.0bn/A$4.5bn pipeline value has been converted into approved capital expenditure, project cost or construction status.
- Section 2 gives the complete 42-destination FY2025 ownership/co-owner list and FY2021–FY2025 compendium continuity. It does not convert a Property Compendium
50%interest into a uniform accounting conclusion. - Where the annual-report review identifies no separately disclosed transaction, project cost, centre name, approval stage or delivery outcome, the text says so rather than estimating a value or completion date.
09
8. Five-year income, FFO, distributions, property values and capital management
Reporting basis: measures that should not be merged
Scentre Group reports on a 31 December financial year and operates through a stapled security: one Scentre Group Limited share and one unit in each of Scentre Group Trusts 1, 2 and 3 trade together. A security distribution is therefore not interchangeable with a conventional company dividend. The Group’s annual-report presentation also separates three profit measures. Statutory profit/(loss) after tax includes unrealised fair-value movements; operating profit is a non-IFRS management measure; and Funds From Operations (FFO) is a non-IFRS measure. In FY2021 the issuer described FFO as NAREIT-based, adjusted to its reporting basis, and stated that the reconciliation was unaudited. The reported five-year tables contain restatements excluding rent straight-lining (FY2021 restated FY2017–FY2019; FY2022 restated FY2019–FY2021; FY2023 restated FY2019). The table below uses the issuer’s reported annual series rather than combining unreconciled earlier editions.
Earnings and security distributions
| Year ended 31 December | Statutory profit/(loss) after tax (A$m) | Operating profit (A$m) | FFO (A$m) | FFO per security (cents) | Distribution per security (cents) | Distribution amount (A$m) |
|---|---|---|---|---|---|---|
| 2021 | 887.9 | 845.8 | 862.5 | 16.64 | 14.25 | 738.7 |
| 2022 | 300.6 | 1,022.0 | 1,039.9 | 20.06 | 15.75 | 816.5 |
| 2023 | 174.9 | 1,079.9 | 1,094.2 | 21.11 | 16.60 | Not repeated in the five-year table used here |
| 2024 | 1,049.8 | 1,121.8 | 1,132.3 | 21.82 | 17.20 | 893.0 |
| 2025 | 1,778.5 | 1,185.9 | 1,187.5 | 22.82 | 17.72 | 923.0 |
The series records FFO of A$862.5m in FY2021 and A$1,187.5m in FY2025. Its statutory-result column does not move on the same basis: each annual report says that the statutory measure includes unrealised fair-value movements. FY2021’s FFO reconciliation identified A$16.7m of project income after tax, while operating profit was A$845.8m; it also recorded an expected COVID-19 credit charge of A$168.8m in that reconciliation-period table. FY2022 reported FFO of A$1,039.9m, operating profit of A$1,022.0m and a A$300.6m statutory result; the report separately referred to A$79m of property-revaluation gains and mark-to-market financial-derivative adjustments. FY2023 reported FFO of A$1,094.2m and statutory profit of A$174.9m. In FY2024 and FY2025, the disclosed FFO figures were A$1,132.3m and A$1,187.5m respectively, with distributions of A$893m and A$923m.
Managed portfolio, Group share and accounting-property boundaries
AUM, Group share of AUM and the consolidated investment-property balance each use a different reporting boundary. Total AUM is the managed-portfolio measure; Group share of AUM represents the issuer’s stated share; consolidated investment properties are an accounting balance and exclude equity-accounted portfolio amounts. The residual column below is only a transparent subtraction of the two reported AUM measures. It should not be read as a separately identified asset pool, value movement or income stream.
| Year ended 31 December | Total AUM (A$bn) | Group share of AUM (A$bn) | Total less Group share (A$bn) | Consolidated investment properties at year end (A$m) | Boundary note |
|---|---|---|---|---|---|
| 2021 | 50.4 | 34.4 | 16.0 | 31,490.9 | FY2021 reported A$16.0bn as third-party funds. |
| 2022 | 51.2 | 35.0 | 16.2 | 32,153.9 | Annual report expressly described A$35.0bn SCG investment and A$16.2bn third-party funds. |
| 2023 | 50.2 | 34.3 | 15.9 | 31,456.9 | Residual is calculated from the two reported AUM measures. |
| 2024 | 50.2 | 34.7 | 15.5 | 31,959.5 | Consolidated balance remains distinct from total AUM. |
| 2025 | 51.2 | 34.0 | 17.2 | 31,313.6 | The accounting total included A$863.7m classified as held for sale. |
The FY2021 portfolio was reported as A$50.4bn AUM, A$34.4bn Group share and A$16.0bn third-party funds. FY2022’s report made the same distinction explicitly. In later years the residual shown above is arithmetic, retained simply to make the managed/Group boundary visible. It is not labelled as third-party funds unless the cited report does so. At 31 December 2025, total AUM was A$51.2bn while the Group’s share was A$34.0bn; that presentation should not be equated with the A$31.3136bn consolidated investment-property amount.
Investment-property movements and the disclosed valuation process
The annual-report notes state that shopping-centre investment properties are initially measured at cost and subsequently carried at fair value. Directors assess carrying values at each reporting date using recent independent valuations, generally prepared annually and updated for changes in capitalisation rates, underlying income and comparable-centre evidence. This describes the issuer’s accounting process and inputs; it is not a view on present or future property values.
| Year ended 31 December | Opening investment properties (A$m) | Capital expenditure (A$m) | Capitalised finance costs (A$m) | Disposals (A$m) | Tenant-allowance amortisation (A$m) | Straight-lining of rent (A$m) | Net revaluation increment/(decrement) (A$m) | Closing investment properties (A$m) |
|---|---|---|---|---|---|---|---|---|
| 2021 | 31,214.0 | 243.6 | Not shown in this movement table | — | (60.2) | — | 93.5 | 31,490.9 |
| 2022 | 31,490.9 | 478.9 | Not shown in this movement table | — | (66.8) | — | 250.9 | 32,153.9 |
| 2023 | 32,153.9 | 410.5 | Not shown in this movement table | (65.0) | (68.6) | 8.0 | (981.9) | 31,456.9 |
| 2024 | 31,456.9 | 423.1 | 32.2 | — | (65.5) | 10.4 | 102.4 | 31,959.5 |
| 2025 | 31,959.5 | 283.7 | 24.6 | (1,368.5) | (64.5) | 16.0 | 462.8 | 31,313.6 |
The FY2023 movement table separately records a A$65.0m disposal and a A$981.9m net revaluation decrement. The disposal was the sale of development rights for the retail element of Central Barangaroo; it is not the same item as the revaluation entry. FY2025 records a A$462.8m net revaluation increment and A$1.3685bn of disposals. The FY2025 financial note says the disposal line includes the sale of a 50% interest in Westfield Chermside to Dexus-managed funds, completed in two 25% tranches on 31 July and 23 December 2025. The A$863.7m held-for-sale balance relates to the later sale of a 19.9% Westfield Sydney interest, which completed on 3 February 2026; it was held for sale at the 31 December 2025 balance date and is not treated here as FY2025 operating activity.
Debt, liquidity, hedging and ratings
The financing disclosures use several different measures. Senior borrowings and subordinated notes below are accounting liability categories; liquidity and gearing are issuer-presented measures. Consequently, a number from one column should not be substituted for another. In particular, FY2021’s A$9.5bn “borrowings” capital-management-panel figure reflects an adjusted presentation and is not interchangeable with the A$10.6082bn total-senior-borrowings amount in the financial-statement note.
| Year ended 31 December | Senior borrowings (A$m) | Subordinated notes (A$m) | Total interest-bearing liabilities (A$m) | Gearing | Available liquidity / financing resources | Reported hedging, maturity and rating facts |
|---|---|---|---|---|---|---|
| 2021 | 10,608.2 | 4,133.9 | 14,742.1 | 27.5% | A$5.6bn | 4.1-year weighted average debt maturity; 50% of interest-rate exposure hedged; 4.2% weighted average interest rate; S&P A Stable, Fitch A Stable and Moody’s A2 Stable. |
| 2022 | 11,008.8 | 4,403.3 | 15,412.1 | 27.3% | A$4.7532bn (A$4.0742bn available facilities plus A$679.0m cash) | Facility disclosures distinguish fixed-rate notes and secured/unsecured floating-rate facilities; some facilities had negative-pledge arrangements and specified requirements. |
| 2023 | 11,476.6 | 3,963.6 | 15,440.2 | 30.4% | A$3.5bn | The CEO message said liquidity covered debt maturities through end-2025, maintained a single-A rating and noted a US$300m subordinated-note repurchase. |
| 2024 | 12,504.8 | 4,188.0 | 16,692.8 | 30.9% | A$3.6bn | November 2024 A$1.25bn senior-notes issue extended weighted average debt maturity; 94% of interest-rate exposure hedged at January 2025; 2.99% average base rate; single-A rating reported. |
| 2025 | 11,383.2 | 3,511.5 | 14,894.7 | 30.4% | A$5.2bn | Remaining A$1.0bn NC2026 notes redeemed in March; A$650m NC2031 notes and A$350m bank draws used as funding; A$1.0bn 10-year domestic senior notes and €500m eight-year senior notes issued; S&P and Moody’s single-A ratings reported. |
For FY2021, the annual report also listed facility covenant thresholds of net debt/net assets no greater than 65%, secured debt/total assets no greater than 40% (45% for certain facilities), interest cover at least 1.5 times and unencumbered leverage at least 150% (125% for certain facilities), and stated compliance in FY2021 and FY2020. These are facility terms, not performance targets. A single, comparable five-year covenant-headroom series was not identified in the reviewed disclosures and is therefore not inferred. The FY2024 94% hedge figure is dated January 2025 rather than 31 December 2024, which is retained in the table.
Capital partnerships and transaction timing affecting the financial boundary
Financial comparability also changed with selected destination co-ownership transactions. In June 2024, a Tea Tree Plaza opportunity trust purchased 50% for A$310m and SCG retained 50%; in September 2024, a West Lakes opportunity trust acquired 50% for A$175m and SCG retained 50%. In FY2025, two Dexus-managed funds acquired two 25% interests in Westfield Chermside, totalling 50% by 23 December 2025. The first interest was A$683m; the issuer stated that the combined transaction was approximately A$1.3bn, represented SCG book value at 30 June 2025 and used a 5.00% capitalisation rate. SCG said it remained property, leasing and development manager. The 19.9% Westfield Sydney interest sale to Australian Retirement Trust completed after the FY2025 balance date, on 3 February 2026, for A$864m at a 4.69% valuation capitalisation rate; SCG also said it remained property, leasing and development manager.
The FY2025 finance narrative referred to approximately A$2.2bn of new capital introduced through destination joint ventures. That aggregate is retained as an issuer-reported total; it is not substituted for individual transaction consideration, nor treated as an AUM movement without a reconciled AUM disclosure.
Section sources (issuer-hosted documents; printed PDF pages): Scentre Group 2021 Annual Financial Report, pp.2, 16, 87, 98–99; Scentre Group 2022 Annual Financial Report, pp.2, 4, 22–23, 50–51, 94–95, 106–107; Scentre Group 2023 Annual Financial Report, pp.4, 8–9, 48–49, 89, 100–101; Scentre Group 2024 Annual Report, pp.6–7, 23, 54, 97, 109; Scentre Group 2025 Annual Report, pp.22–23, 66, 135, 147.
These sections cover the five financial years ended 31 December 2021–2025. They retain the reporting boundary used by Scentre Group: a target applicable to wholly owned Westfield destinations is not presented as a result for every destination, and a portfolio-wide measure is not treated as an individual-centre outcome. Figures, targets and process descriptions below are company disclosures, organised chronologically; they are not an assessment of effectiveness or future performance.
10
9. Responsible business, climate, resource efficiency and community commitments
Scentre’s five annual-report narratives describe responsible business through community, people/talent, environmental impact and economic performance. The form of the reporting suite became more explicit over the period: FY2021–FY2024 referred readers to supplementary Responsible Business, climate and modern-slavery materials, while FY2025 incorporated a Sustainability Report into the annual report. That change in presentation does not make early-year supplementary information comparable with a later annual-report metric unless the issuer stated the same basis.
Five-year climate, resource and community record
| Financial year ended 31 December | Climate and energy disclosure | Resource-efficiency disclosure | Community, supplier or people-programme disclosure | Boundary / status retained |
|---|---|---|---|---|
| 2021 | The Group had committed to net-zero Scope 1 and 2 emissions by 2030 for its wholly owned portfolio and developed a pathway/transition plan that included at least a 50% reduction by 2025. It reported that New Zealand destinations used 100% certified renewable electricity from the start of 2021, 3.5% lower total-portfolio electricity use excluding COVID-19 impacts, and a 4.47-star portfolio-average NABERS Energy rating (4.4 in 2020). | Water use was reported 2% lower year on year, with estimated 189,000 kL savings from early-loss detection through smart meters. | The annual report described environmental action plans, climate-scenario analysis and responsible-business governance; it also reported GRESB Overall Global Sector Leader recognition in retail development and CDP “A” Climate Leader status. | Net-zero and the 2025 reduction were a target/pathway, not a completed outcome. Electricity, NABERS and water measures have their stated portfolio/COVID-adjusted bases; the recognitions are not asset-performance totals. |
| 2022 | The stated target remained net zero Scope 1 and 2 by 2030 for wholly owned assets. The Group reported a 38% reduction in Scope 1 and 2 emissions since 2014 across the Westfield-destination portfolio. It signed an agreement for 100% renewable electricity for the Queensland portfolio from 2025 and reported New Zealand centres powered by renewable electricity. | No like-for-like operational water or waste result is separately used here from the reviewed annual-report lane. | The responsible-business framework was described through four pillars. The report stated $21m of direct and in-kind community investment over the preceding four years, and recorded an Auslan Santa pilot developed with Deaf Australia. Key-talent retention was 93% against a >90% target. | The $21m is a four-year cumulative figure, not FY2022-only spending. The Queensland agreement was future supply; it is not described as 2022 renewable consumption. |
| 2023 | The Group reported a 41% reduction in Scope 1 and 2 emissions across the portfolio since 2014, while retaining the 2030 net-zero Scope 1 and 2 target for the wholly owned portfolio. Four rooftop solar installations increased disclosed solar-generation capacity from 5.9 MW to 12.2 MW; long-term energy agreements in NSW and Victoria were reported in addition to Queensland and New Zealand arrangements. | Climate-exposure assessments were updated for 37 Australian centres, and long-term climate-exposure assessments were reported complete for all 42 destinations. Centre-specific Climate Change Adaptation Plans were described as being progressively developed. | The Group stated $27m of local-community investment over the previous five years, including $6.2m of grants to groups represented by 2019–2023 Westfield Local Heroes. | A portfolio reduction and a wholly-owned target use different stated boundaries. Assessments and developing adaptation plans are risk-management processes, not completed physical adaptations. The community totals are multi-year cumulative measures. |
| 2024 | The stated 2030 target remained net-zero Scope 1 and 2 emissions across wholly owned Westfield destinations. The report gave a 41% reduction in total-portfolio Scope 1 and 2 emissions from the 2014 location-based baseline, alongside a 50% by-2025 market-based interim target. It reported long-term energy agreements covering 88% of the portfolio, staggered from 2025, and embedded electricity networks at 28 destinations. | Operational waste diversion was 52%, one percentage point above FY2023. A strategic operational-waste plan had commenced implementation and a strategic water-efficiency plan had been developed for implementation in 2025. The Group identified four Scope 3 categories for measurement/reporting and said it was preparing for mandatory Scope 3 reporting for FY2026. | The report recorded Global Sector Leader recognition in the Development category of the 2024 GRESB Real Estate Assessment for a fifth consecutive year. | The location-based total-portfolio reduction, market-based interim target and wholly-owned target are not interchangeable. Waste figures were stated to use estimates and refer to a data pack; plans and Scope 3 preparation are not completed results. |
| 2025 | The FY2025 annual report specified the 2030 target as net-zero Scope 1 and 2 emissions from a 2014 baseline for wholly owned Westfield destinations. It reported a 57% market-based reduction on that FY2025 wholly-owned basis, compared with a 42% FY2024 figure adjusted to that basis, and said it exceeded its interim 50% reduction target. Queensland destinations excluding Helensvale were described as net-zero Scope 2 in 2025. The reported average Retail NABERS Energy target of 4.5 stars was achieved. | Operations recovered 52% of waste against a 90% 2030 target. Major developments recovered 93% against a >95% target, compared with 91% in 2024. Water use fell 1.4% year on year; base-flow reviews were completed at all destinations and sub-metering was implemented at two high-water-use destinations. | The report stated that more than 99.1% of suppliers were local Australian/New Zealand businesses, more than $17.7m was paid to accredited Aboriginal and Torres Strait Islander suppliers, and 2025 community investment was $10.6m. | The 57% result applies to the stated market-based, wholly-owned-destination methodology, not all managed or co-owned destinations. Waste targets were not yet achieved. Supplier and community amounts are disclosed programme measures, not a complete supply-chain or social-impact assurance result. |
Comparability notes
- Emissions boundary changes matter. FY2021–FY2024 distinguish whole/total-portfolio measures from a 2030 target directed to the wholly owned portfolio. FY2025 presents a 57% market-based reduction for wholly owned destinations and recasts the FY2024 comparator to that FY2025 basis. The series should therefore be read as issuer-reported progress under explicitly different disclosed bases, not as an unqualified annual emissions series for every centre.
- Target, action and result are separate. Renewable-energy contracts, solar installations, exposure assessment, adaptation-plan development, waste plans and water plans are reported actions or arrangements. They are not treated as proof that a net-zero or resource target was completed.
- Programme totals are not annual profit-and-loss items. The FY2022 $21m and FY2023 $27m community figures cover stated multi-year periods. The FY2025 $10.6m figure is an annual disclosed community-investment measure. These values should not be added as a like-for-like annual sequence.
Section sources.
- Scentre Group 2021 Annual Financial Report, printed pp. 14–17 and 24–25. Printed pages are cited from the issuer-hosted annual report.
- Scentre Group 2022 Annual Financial Report, printed pp. 8–9, 20–21, 30–31.
- Scentre Group 2023 Annual Financial Report, printed pp. 9, 20–21, 29–31.
- Scentre Group 2024 Annual Financial Report, printed pp. 5, 13, 26–27.
- Scentre Group 2025 Annual Report, printed pp. 12, 28–29.
11
10. People, safety, security and material operating risks
The annual reports describe workforce measures and risk-management arrangements over five periods. They do not present those arrangements as a guarantee that an incident will not occur, and this record does not make that inference. Similarly, the dated Westfield Bondi record is retained as a safety, community and response disclosure; it is not used to assert a causal effect on sales, value, rent, financing or future operating results.
Workforce and engagement measures disclosed by year
| Financial year ended 31 December | Workforce / engagement disclosure | Safety, security or operating-risk disclosure | Important boundary |
|---|---|---|---|
| 2021 | 2,780 people across Australia and New Zealand; 92% of the workforce in Australia and 56% female. Employee engagement was reported at 85%, which the Chair described as top 5% globally. | Centres remained open under COVID-Safe protocols; the Group worked with health providers on walk-in and drive-through vaccinations. The report described life-safety programmes, dedicated risk/security personnel, terrorism-threat response and centre emergency plans, annual business-continuity/disaster-recovery testing, cyber monitoring/training, third-party standards and cyber insurance. | The engagement ranking is an issuer statement. Control descriptions do not establish prevention of incidents or the presence/absence of a cyber event. |
| 2022 | The annual report reported 93% key-talent retention against a >90% target. Elliott Rusanow became CEO and Andrew Clarke CFO on 1 October 2022. | Risk oversight was described through Board, Audit and Risk Committee, Executive Risk Management Committee, risk and audit functions. The report identified financial, external operating-condition, portfolio/demand and non-financial lanes, including life safety/security and cyber/privacy/data governance. Inflation and interest rates were named as exposures; long-term lease escalations and hedging were reported mitigants. | Key-talent retention is not a whole-workforce retention measure. Risk categories and stated mitigants are not predictions or outcome guarantees. The later Bondi incident does not belong in FY2022. |
| 2023 | 2,964 people were reported across Australia and New Zealand. The report stated that 91% of respondents to a new anonymous People Pulse Check answered that they would recommend Scentre as a workplace. | The ERM framework, Board/Audit and Risk Committee oversight, life safety/security and cyber/privacy/data working groups were described. Operational-risk disclosures covered crisis/emergency readiness, workplace health and safety, centre security/emergency management, IT/data/cybersecurity and business continuity. | The cited passage does not give the People Pulse response rate. The report’s risk-management description is not evidence that a risk was eliminated. |
| 2024 | 2,860 people were reported; the second People Pulse Check reported 89% engagement with 67% participation. The report also disclosed 353 permanent people moving to new roles, 239 promotions (55% female) and 94 alumni rejoining. | The report described Board-approved risk appetite, annual ERM review, working groups for life safety, security, cyber, sustainability and privacy/data utilisation, and risk oversight. It also contains the dated Westfield Bondi response record below. | Engagement and participation are distinct measures. The report’s financial-risk controls—funding diversity, staggered maturities and hedging—are company-described controls, not a forecast. |
| 2025 | 2,799 people and a 96% employee-engagement score were reported. Women represented 50.0% of the Board, 57.2% of the total workforce and 40.0% of key management personnel. | The Group described critical-control work including electrical-board isolation/lock/upgrade requirements before de-fitting, a silica-management standard and a traumatic-event framework. Its ERM disclosures list life safety, security, cyber, privacy and data utilisation, and describe diversified debt sources, staggered maturities, rolling cash-flow forecasts and derivatives for interest/FX exposure. | Representation values use the report’s separate Board, workforce and key-management definitions. Company-described measures do not eliminate safety, cyber, financing, tenant/customer, climate or other risks. |
Westfield Bondi: dated incident and report-disclosed response sequence
| Date / period | Record in Scentre reporting | Status control |
|---|---|---|
| 13 April 2024 | The FY2024 annual report records an attack at Westfield Bondi in which six people died, including a Group security-team member. It records assistance to emergency services and the police investigation. | Dated incident record only. No financial, portfolio-traffic, valuation or operational causation is inferred. |
| 18–19 April 2024 and following week | The FY2024 report records a Community Reflection Day on 18 April, a memorial location and condolence book, Westfield Bondi reopening on 19 April, and some business partners reopening over the following week. It states that business-partner rent was waived from 13–19 April inclusive and counselling/support was made available. | Reopening, rent waiver and support are disclosed actions, not a measure of a longer-term financial effect. |
| FY2024 response actions | Scentre reported increased portfolio security, including personal protective vests for security officers, a safety-camera trial intended for all 42 destinations, and exploration of video analytics, enhanced CCTV and control-room capability. It states that security staff observe, report and escalate to authorities and are not law enforcement. | Reported actions and role boundary; not an effectiveness conclusion. |
| FY2025 and subsequent report-date disclosure | FY2025 records the first anniversary, a person-centred trauma-informed support model, voluntary ongoing counselling access for team members/families and access for business partners/customers as required. It says Scentre supported the NSW Coroner process and records that the Coroner released findings and recommendations on 5 February 2026. | The release date is a later event disclosed in a FY2025 report issued 24 February 2026. This report records the issuer’s disclosure, without characterising the inquest or drawing causal/financial conclusions. |
Material risk lanes: five-year disclosure boundary
| Risk lane | Five-year recurring disclosure | Limits on this record |
|---|---|---|
| Life safety, security and emergency readiness | Each reviewed period describes life-safety/security responsibilities or emergency planning; FY2024–FY2025 add the Bondi response and subsequent control/trauma-framework disclosures. | No assertion that controls prevent all incidents or that a disclosed event has a quantified financial effect. |
| Information security, privacy, data and business continuity | FY2021 describes monitoring, training, standards, insurance and annual continuity testing. FY2022–FY2025 retain cyber/privacy/data and continuity as risk-framework lanes, with controls, monitoring/testing and periodic audit descriptions. | The annual-report disclosures do not support stating that an incident occurred—or that none occurred—unless separately reported. |
| Financing, liquidity, interest and FX exposure | The reports identify debt access, maturities, interest rates, foreign exchange, liquidity and credit as risk lanes and describe funding diversity, hedging, derivatives and rolling cash-flow forecasts. | These are management-described arrangements; no interest-rate, refinancing, consumer-demand or rent outcome is projected here. |
| Customer/tenant demand, supply chain, climate and regulatory conditions | FY2021–FY2025 reports identify operational conditions, customer/tenant, supplier/human-rights, climate and regulatory risks within the Group framework. FY2023–FY2025 add more detailed climate scenario/transition and reporting-readiness disclosures. | A policy, due-diligence process or assessment does not constitute assurance of supplier, tenant, climate or regulatory outcomes. |
Section sources.
- Scentre Group 2021 Annual Financial Report, printed pp. 4–5, 8–9, 20–25. Printed pages are cited from the issuer-hosted annual report.
- Scentre Group 2022 Annual Financial Report, printed pp. 6–9, 24–29.
- Scentre Group 2023 Annual Financial Report, printed pp. 3, 20, 25–31.
- Scentre Group 2024 Annual Financial Report, printed pp. 1–3, 5–7, 12, 17, 24–25, 28–31, 40.
- Scentre Group 2025 Annual Report, printed pp. 4, 6–7, 12, 16–17, 24, 26–34.
12
11. Governance, reporting suite and five-year record boundary
This section maps the annual-report and governance boundary needed to read the rest of the record. It does not reproduce policy boilerplate, describe individual remuneration outcomes, or assess Board effectiveness. References to planned director changes remain prospective where the issuer described them that way.
Annual-report suite and governance chronology
| Financial year ended 31 December | Reporting-suite / governance disclosure | Record boundary |
|---|---|---|
| 2021 | The Annual Financial Report was organised around results, purpose/strategy, letters to securityholders, Directors’ Report, auditor’s report and financial statements. It said the Responsible Business Report and Modern Slavery Statement would be released in March 2022. Catherine Brenner’s appointment from 1 March 2022 and Steven Leigh’s intended retirement at the 7 April 2022 AGM were disclosed. | The proposed March 2022 documents and 2022 board events are not treated as FY2021 operating performance. |
| 2022 | The Group stated that its governance framework was consistent with the ASX Corporate Governance Council’s fourth-edition Principles and Recommendations. The annual report listed policies including conduct, anti-bribery/corruption, continuous disclosure, diversity/equity/inclusion, environment, human rights, supplier and whistleblower policies. Steve McCann joined the Board from 1 November 2022; Andrew Harmos said he would not stand for re-election at the 2023 AGM. | Policy listing is a reporting-framework disclosure, not an assessment that every policy outcome was achieved. The non-re-election statement is prospective at the FY2022 report date. |
| 2023 | The FY2023 reporting suite listed a Property Compendium, Corporate Governance Statement, Responsible Business Report, Climate Statement and Modern Slavery Statement. The governance framework was again stated to be consistent with the fourth-edition Principles and Recommendations. The Annual Financial Report stated that, effective 1 April 2024, the Audit and Risk Committee was to be split into an Audit and Finance Committee and a Risk and Sustainability Committee. | Supplementary documents are separate components of the suite; their content is not presumed where not cited. The committee change is a post-FY2023 effective-date disclosure. |
| 2024 | The FY2024 suite comprised the Annual Report, Responsible Business Report, Property Compendium, Corporate Governance Statement and Modern Slavery Statement. On 1 April 2024, the Audit and Risk Committee was restructured into the Audit and Finance Committee and Risk and Sustainability Committee. The report records three additional out-of-cycle Board meetings after a critical incident. Stephen McCann retired during 2024 and Craig Mitchell was appointed an independent non-executive director on 14 October 2024. | The report identifies the reporting period as 1 January–31 December 2024. The out-of-cycle-meeting disclosure is retained without inferring decisions, financial consequences or governance effectiveness. |
| 2025 | The FY2025 annual report has standalone Strategic Review, Corporate Governance Statement and Sustainability Report sections alongside the Directors’ Report and Financial Report. The Chair’s message states Julie Coates joined the Board during the year and planned to stand for election at the 2026 AGM; it states that Mike Ihlein was expected to retire at that AGM and that Craig Mitchell was expected to succeed him as Audit and Finance Committee chair. | The FY2025 report architecture is a presentation/reporting-suite change, not a change in legal entity. The election, retirement and succession statements remain prospective at the report date. |
Reporting and stewardship boundary used in this report
- Annual reporting period: FY2021–FY2025 each cover the year ended 31 December; publication dates in the following February do not shift the operating period.
- Supplementary documents: Property Compendiums provide the detailed destination/operating register; Responsible Business, Climate, Corporate Governance and Modern Slavery publications are parts of the issuer’s reporting suite. Where this report cites an annual-report claim, it names the annual report and printed page rather than implying that an uncited suite document was read.
- Governance versus operating evidence: committee structures, policy lists, appointments, planned elections and anticipated retirements provide governance context only. They do not establish portfolio performance, safety effectiveness, financial outcomes or future Board composition beyond the dates and status stated.
Section sources.
- Scentre Group 2021 Annual Financial Report, printed pp. 1, 4–5, 14–15, 20–21. Printed pages are cited from the issuer-hosted annual report.
- Scentre Group 2022 Annual Financial Report, printed pp. 6–7, 24–25.
- Scentre Group 2023 Annual Financial Report, printed pp. 2, 24, 32.
- Scentre Group 2024 Annual Financial Report, printed pp. 3, 6, 33, 40.
- Scentre Group 2025 Annual Report, printed pp. 1–2, 4, 34, 51, 89, 119.
Disclosure limits retained
- Public source notes use Scentre Group’s issuer-hosted report PDFs and printed pages only. Every cited document is issuer-hosted; this public report contains only reader-accessible source links and printed-page references.
- The Responsible Business, Climate, Modern Slavery and Corporate Governance components of early-year reporting suites are referenced only as suite components unless an underlying claim is explicitly sourced above. A separate source pass is required before adding claims unique to those documents.
- The annual reports disclose risk frameworks, targets, management actions and selected results. They do not support an assertion that safety, security, cyber, climate, financing or supply-chain risks are eliminated, or a causal/financial conclusion from the Westfield Bondi incident or inquest process.
13
12. Primary sources
Primary issuer source set
All links below are issuer-hosted documents from Scentre Group’s investor reporting suite. The section-end source notes above identify the documents and printed pages used for the relevant facts; issuer-hosted workbooks are identified by worksheet and row where no printed page exists.
- Scentre Group Annual Reporting Suite
- FY2021 Annual Financial Report and FY2021 Property Compendium
- FY2022 Annual Financial Report and FY2022 Property Compendium
- FY2023 Annual Financial Report and FY2023 Property Compendium
- FY2024 Annual Report and FY2024 Property Compendium
- FY2025 Annual Report and FY2025 Property Compendium
Public discussion
Comments
Verified members' comments appear immediately. Market manipulation, unverified inside information, impersonation, financial solicitation, referral links, personal data and abusive content may be blocked. Signed-in members can report a published comment for review.
No published comments yet.